Website Analytics
In July 2023, Google transitioned from using Universal Analytics (UA) to Google Analytics 4 (GA4). This transition not only impacted the way websites measure their data but also changed how data is reported. In response, the Web Team redesigned the CMS analytics system into a Google Looker Studio dashboard powered by GA4 to ensure departments receive precise analytics.
Where to find your site's analytics
Accessing the new analytics dashboard follows the same familiar steps used for finding your analytics data currently in the CMS:
-
Log in to the CMS.
-
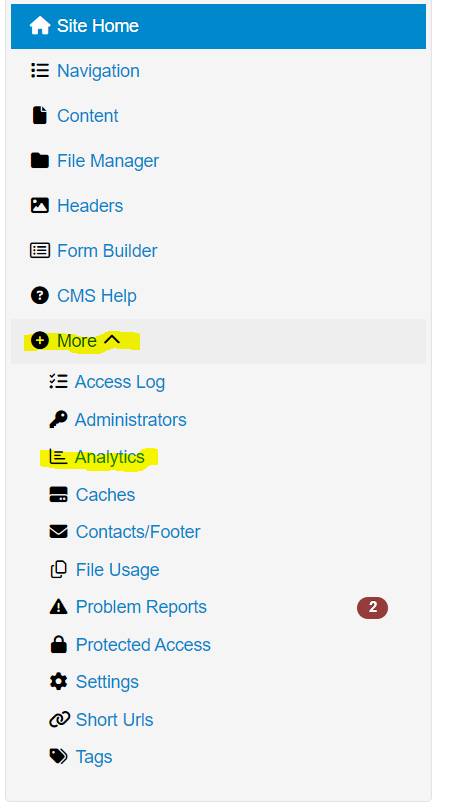
In the left menu, click on +More, and then Analytics.
-
Enter your Gmail account or your GVSU @mail.gvsu.edu email.
-
A Google account is required to view the new dashboard.
-
-
The link will redirect you to your website-specific dashboard.
Using the Analytics Dashboard
Controlling the Dashboard
On each page of the dashboard, you'll discover two essential controls at the top, along with a variety of metrics beneath the headings. These two controls are:
-
Page Title: This control enables users to select one or multiple pages from their website. All the metrics on the dashboard will automatically adjust to display data only for the selected pages. By default, all pages on the site are selected when you first load into the site.
-
Date Range: By default, the date range is set to the previous two weeks. In this control, you can select your desired date range for the specific metrics you want to view. Once chosen, these changes will be instantly reflected in the charts and graphs on the dashboard.
*One note: these controls only affect the page of the dashboard you’re looking at. Not the entire dashboard.*

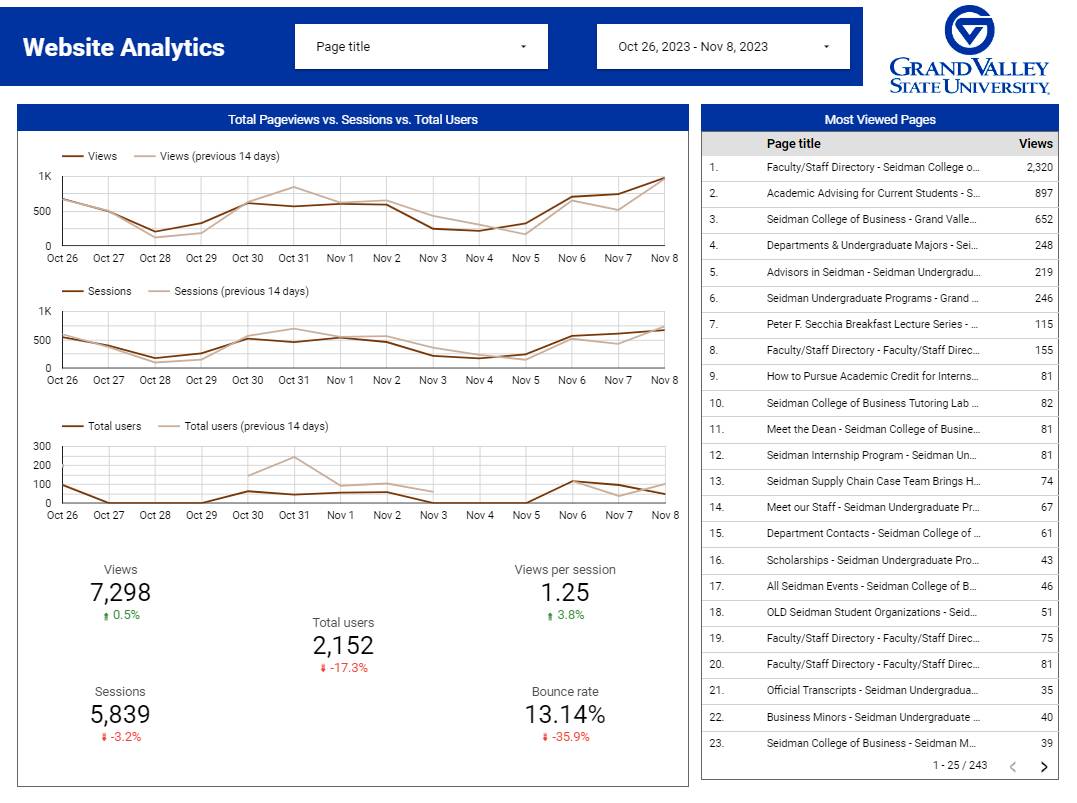
Website Analytics - Page One Metrics
- Total Views
- A view is a single instance of a webpage being loaded or displayed in a web browser.
- Total Sessions
- A session is a single visit or interaction by a user within a website, consisting of a series of pageviews and other interactions within a specific time frame.
- Total Users
- Total users represents the total count of unique individuals who have visited a website within a specified time period, providing an overview of the audience size.
- Views Per Session
- Views per session is a metric that indicates the average number of pages or screens viewed by a user during a single session on a website.
- Bounce Rate
- Bounce rate is the percentage of single-page sessions, representing the proportion of visitors who navigate away from a site after viewing only one page, indicating the effectiveness of a webpage in engaging users.
- Most Viewed Pages
- Top viewed pages are the webpages on a website that have received the highest number of visits or pageviews.
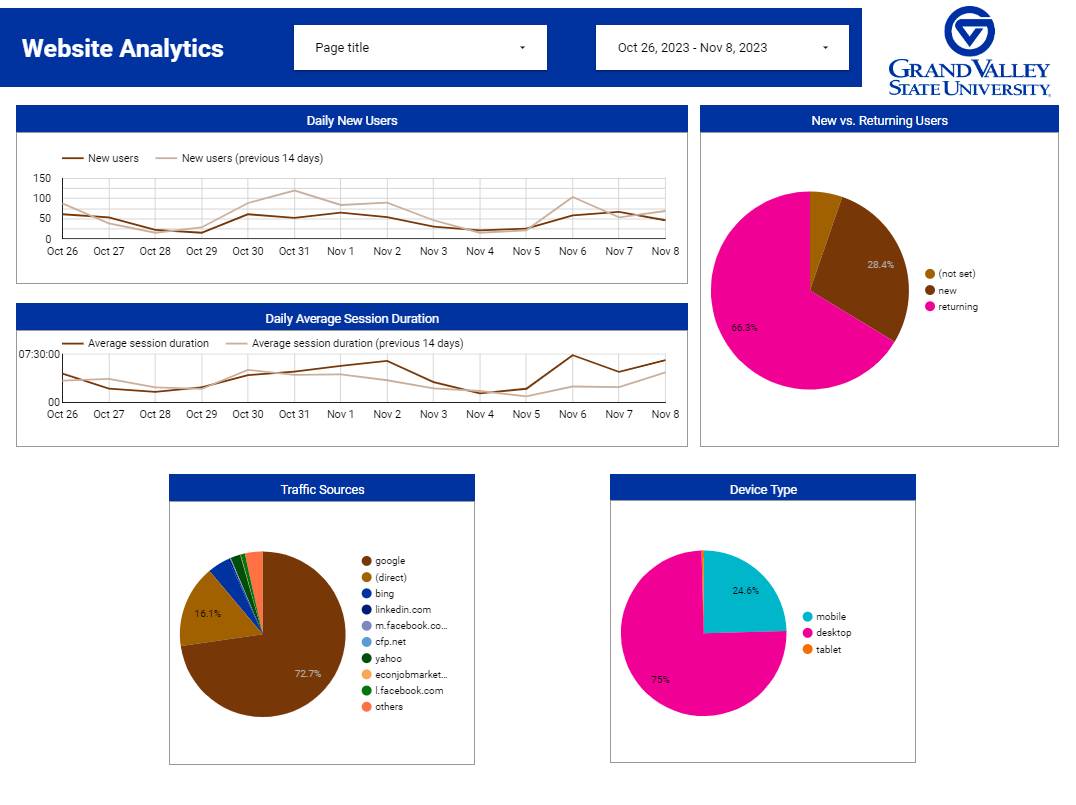
Website Analytics - Page Two Metrics
- New Users
- New users refers to individuals visiting a website for the first time within a specified reporting period, providing insights into the growth and acquisition of the user base.
- New vs. Returning Users
- Returning users are individuals who have visited a website more than once within a specified time period, while new users are those who are visiting the website for the first time.
- Average Session Duration
- Average session duration is the average amount of time users spend on a website during a single session.
- Traffic Sources
- Traffic sources refers to the origins of website visitors, categorizing how users found and accessed the website, such as through search engines, social media, direct visits, or referral sites.
- Device Type
- Device type categorizes users' devices into desktop, mobile, or tablet, helping to understand how visitors access a website and tailor content accordingly.
Need Assistance?
Got questions or want to learn more about your website's analytics? We've got your back! Just drop us a message using the form below, and our team will be happy to assist you!