Student Demographics
Based on Winter 2025 enrollments
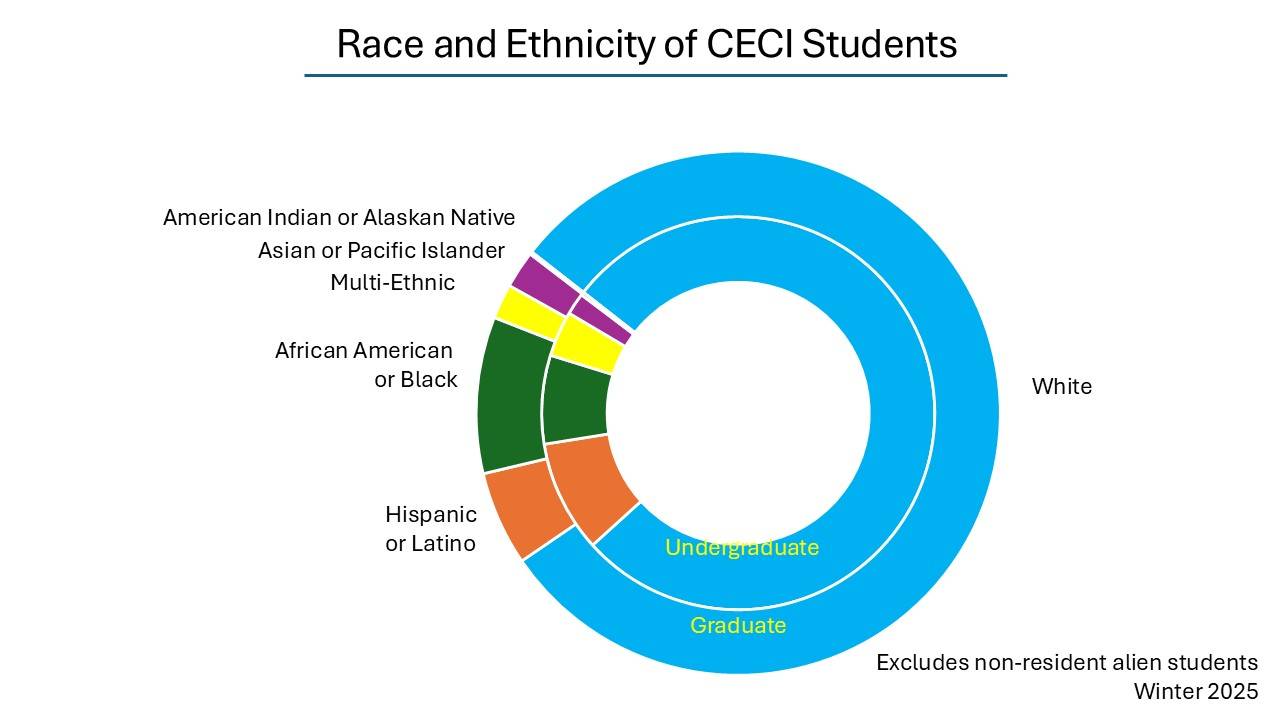
Race/Ethnicity
|
Race / Ethnicity |
Undergraduate Students |
Graduate Students |
|---|---|---|
|
American Indian or Alaskan Native |
07 |
02 |
|
Asian or Pacific Islander |
49 |
30 |
|
African American or Black |
199 |
126 |
|
Hispanic or Latino |
251 |
76 |
|
White |
2122 |
1042 |
|
Multi-Ethnic |
102 |
28 |
Age and Sex
|
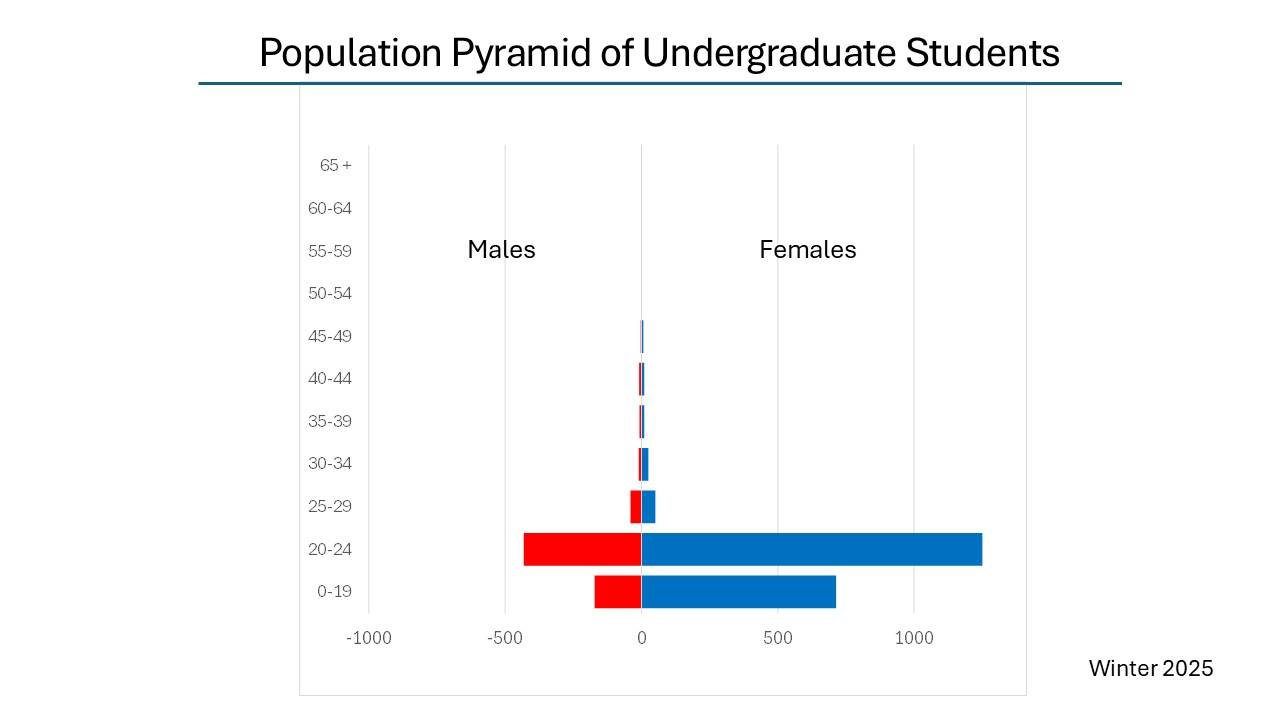
Age of Undergraduate Students |
Female |
Male |
|---|---|---|
|
17-18 |
226 |
52 |
|
19 |
448 |
120 |
|
20 |
430 |
136 |
|
21 |
403 |
129 |
|
22 |
256 |
90 |
|
23 |
107 |
50 |
|
24 |
54 |
27 |
|
25 |
17 |
12 |
|
26-30 |
37 |
31 |
|
31-35 |
23 |
08 |
|
36-40 |
10 |
10 |
|
41+ |
19 |
09 |
|
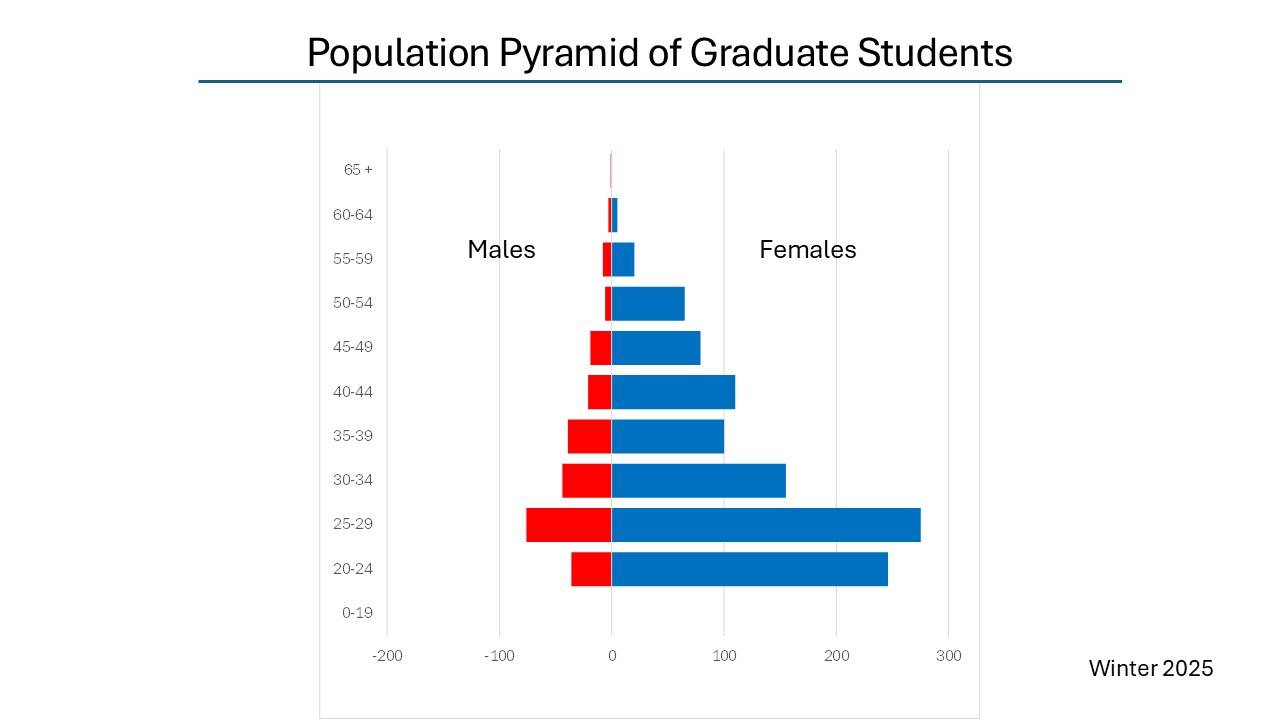
Age of Graduate Students |
Female |
Male |
|---|---|---|
|
20-24 |
246 |
36 |
|
25-29 |
275 |
76 |
|
30-34 |
155 |
44 |
|
35-39 |
100 |
39 |
|
40-44 |
110 |
21 |
|
45-49 |
79 |
19 |
|
50-54 |
65 |
6 |
|
55-59 |
20 |
08 |
|
60+ |
05 |
04 |
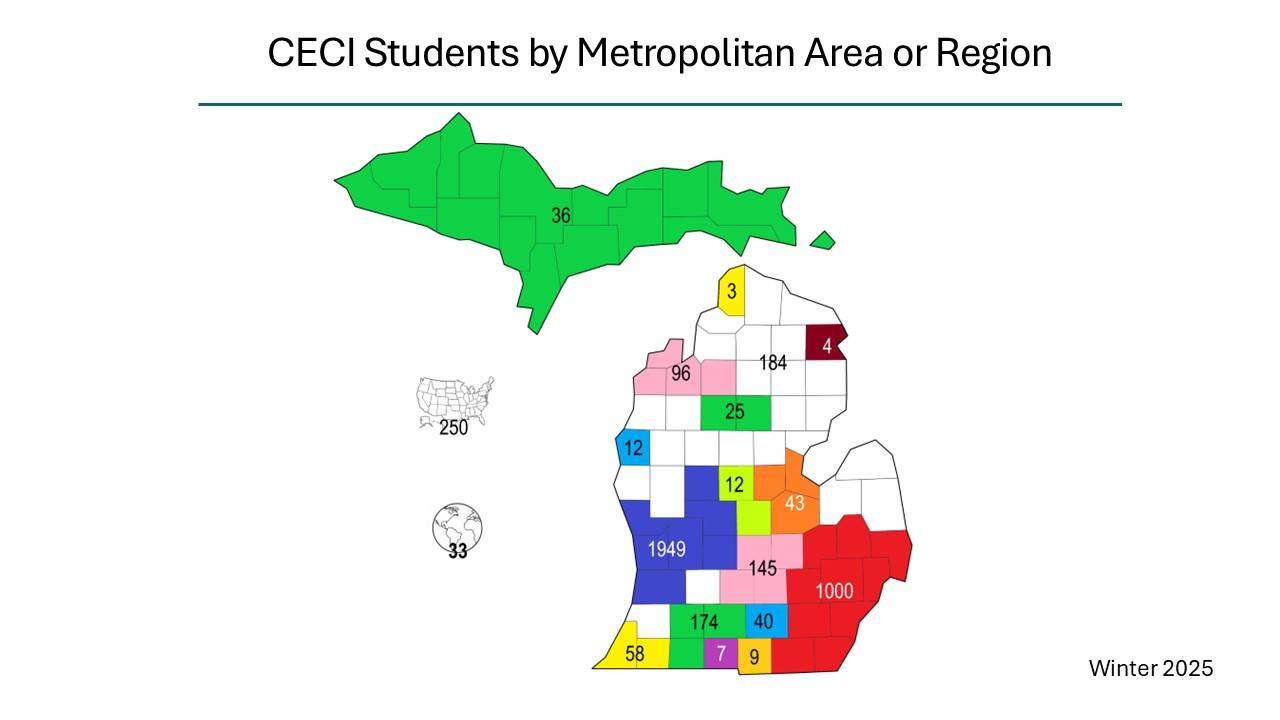
Geography (location of home address)
|
Michigan metropolitan areas and other regions |
Undergraduate Students |
Graduate Students |
|---|---|---|
|
Grand Rapids-Kentwood-Muskegon CSA |
1199 |
750 |
|
Detroit-Warren-Ann Arbor CSA |
780 |
220 |
|
Kalamazoo-Battle Creek-Portage CSA |
104 |
70 |
|
Lansing-East Lansing MSA |
110 |
35 |
|
Traverse City μSA |
41 |
55 |
|
South Bend-Elkhart-Mishawaka CSA |
48 |
10 |
|
Saginaw-Midland-Bay City CSA |
31 |
12 |
|
Jackson MSA |
32 |
08 |
|
Cadillac μSA |
18 |
07 |
|
Mount Pleasant-Alma CSA |
09 |
03 |
|
Ludington μSA |
10 |
02 |
|
Hillsdale, MI μSA |
08 |
01 |
|
Coldwater, MI μSA |
05 |
02 |
|
Alpena, MI μSA |
03 |
01 |
|
Petoskey, MI μSA |
03 |
00 |
|
Remainder of lower peninsula |
113 |
51 |
|
Upper peninsula |
26 |
10 |
|
Other states |
204 |
46 |
|
Other countries |
03 |
30 |