

Regional Economic Valuation
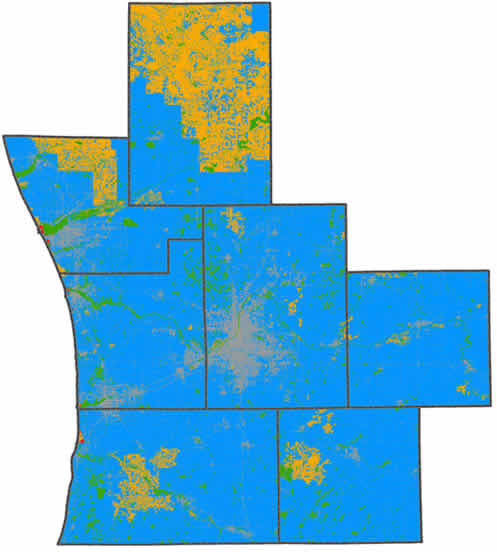
Relative Value Estimate for Green Infrastructure and its Associated Ecosystem Services in West Michigan is ~$1.8 billion per year*
* This amount represents an estimated value only and should not be interpreted as an actual value.
Legend
- Red: > $10,000*
- Orange:$2,001- $10,000*
- Green: $201 - $2,000*
- Blue: $0 - $200*
- Grey:Developed Area/Not Valued
*All values are per acre per year.
Preliminary Value Estimates for Ecosystem Services in West Michigan
(Per Acre Per Year)
|
Cropland |
Orchards & Specialty Crops |
Grass, Shrub & Prairie |
Forest |
Water |
Wetlands |
Great Lakes Sand Dunes & Beach |
Other Bare Lands |
|
|---|---|---|---|---|---|---|---|---|
|
Food Production |
$58 |
$337 |
n/a |
n/a |
n/a |
n/a |
n/a |
n/a |
|
Raw Materials |
n/a |
n/a |
n/a |
$48 |
INS |
INS |
$369 |
$369 |
|
Aesthetic/Amenity |
$23 |
$23 |
$23 |
Private: $38 Public: $3,311 |
NEI |
$19 - $30 |
Private: $19,437 Public: $62,171 |
n/a |
|
Recreation |
$19 |
$19 |
$19 |
Private: $38 Public: $3,311 |
$864 |
$13 - $76 |
Private: $19,437 Public: $62,171 |
n/a |
|
Fish/Wildlife Habitat |
INS |
INS |
$14 |
$3 |
$864 |
$147 - $1,513 |
NEI |
n/a |
|
Pollination |
NEI |
NEI |
INS |
NEI |
n/a |
NEI |
INS |
n/a |
|
Nutrient Cycling |
NEI |
INS |
NEI |
NEI |
NEI |
$1,067 -$2,040 |
NEI |
n/a |
|
Waste Assimilation |
n/a |
n/a |
NEI |
NEI |
NEI |
$1,067 -$2,040 |
NEI |
n/a |
|
Erosion Control |
NEI |
NEI |
NEI |
$21 |
n/a |
$86 - $485 |
NEI |
n/a |
|
Water Regulation |
INS |
INS |
NEI |
NEI |
NEI |
NEI |
INS |
n/a |
|
Water Supply |
n/a |
n/a |
n/a |
n/a |
$59 |
$59 |
n/a |
NEI |
NEI: Not enough information
INS: Value presumed to be insignificant
n/a: not applicable
Select a descriptor for additional information.
- Orchards & Specialty Crops : Food Production
- Orchards & Specialty Crops : Raw Materials
- Orchards & Specialty Crops : Aesthetic/Amenity
- Orchards & Specialty Crops : Recreation
- Orchards & Specialty Crops : Fish/Wildlife Habitat
- Orchards & Specialty Crops : Pollination
- Orchards & Specialty Crops : Nutrient Cycling
- Orchards & Specialty Crops : Waste Assimilation
- Orchards & Specialty Crops : Erosion Control
- Orchards & Specialty Crops : Water Regulation
- Orchards & Specialty Crops : Water Supply
- Grass, Shrub & Prairie : Food Production
- Grass, Shrub & Prairie : Raw Materials
- Grass, Shrub & Prairie : Aesthetic/Amenity
- Grass, Shrub & Prairie : Recreation
- Grass, Shrub & Prairie : Fish/Wildlife Habitat
- Grass, Shrub & Prairie : Pollination
- Grass, Shrub & Prairie : Nutrient Cycling
- Grass, Shrub & Prairie : Waste Assimilation
- Grass, Shrub & Prairie : Erosion Control
- Grass, Shrub & Prairie : Water Regulation
- Grass, Shrub & Prairie : Water Supply
- Forest : Food Production
- Forest : Raw Materials
- Forest : Aesthetic/Amenity & Recreation (Private Lands)
- Forest : Aesthetic/Amenity & Recreation (Public Lands)
- Forest : Fish/Wildlife Habitat
- Forest : Pollination
- Forest : Nutrient Cycling
- Forest : Waste Assimilation
- Forest : Erosion Control
- Forest : Water Regulation
- Forest : Water Supply
- Great Lakes Sand Dunes & Beach : Food Production
- Great Lakes Sand Dunes & Beach : Raw Materials
- Great Lakes Sand Dunes & Beach : Aesthetic/Amenity & Recreation (Private Lands)
- Great Lakes Sand Dunes & Beach : Aesthetic/Amenity & Recreation (Public Lands)
- Great Lakes Sand Dunes & Beach : Fish/Wildlife Habitat
- Great Lakes Sand Dunes & Beach : Pollination
- Great Lakes Sand Dunes & Beach : Nutrient Cycling
- Great Lakes Sand Dunes & Beach : Waste Assimilation
- Great Lakes Sand Dunes & Beach : Erosion Control
- Great Lakes Sand Dunes & Beach : Water Regulation
- Great Lakes Sand Dunes & Beach : Water Supply
- Other Bare Lands : Food Production
- Other Bare Lands : Raw Materials
- Other Bare Lands : Aesthetic/Amenity
- Other Bare Lands : Recreation
- Other Bare Lands : Fish/Wildlife Habitat
- Other Bare Lands : Pollination
- Other Bare Lands : Nutrient Cycling
- Other Bare Lands : Waste Assimilation
- Other Bare Lands : Erosion Control
- Other Bare Lands : Water Regulation
- Other Bare Lands : Water Supply
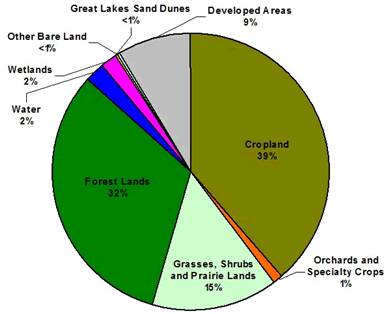
This pie chart and associated table show the break down of land use and the lower bound value estimates for the West Michigan policy region.
|
Land Use and Cover |
Acres |
Estimated Annual Value |
|---|---|---|
|
Cropland |
1,192,127 |
$119,212,726 |
|
Orchards & Specialty Crops |
39,519 |
$14,977,686 |
|
Grasses, Shrubs & Prairie Lands |
456,829 |
$25,582,424 |
|
Forest Lands |
996,189 |
$1,111,015,891 |
|
Water |
67,540 |
$62,339,152 |
|
Wetlands |
58,579 |
$81,483,097 |
|
Great Lakes Sand Dunes & Beaches |
4,762 |
$138,820,172 |
|
Other Bare Lands |
10,265 |
$3,787,718 |
|
Developed Lands |
268,387 |
Not Valued |
|
Total |
3,094,197 |
$1,565,218,867 |
In addition to the data listed above in the value matrix, the Project Team estimated values for ecosystem services associated with rails-to-trails. The West Michigan policy region also has 123.16 miles of rails-to-trails. The Ecosystem Services associated with this land use include Aesthetics/Amenity and Recreation, but there was enough information to determine an ecosystem services value only for Recreation. The estimated value for the rails-to-trails in the West Michigan policy region is $299,401 per mile per year, or ~ $36.9 million (Betz et al. 2003; Siderelis and Moore 1995; Siderelis et al. 2000).