2020 Grand River Sampling
Final Report Summarizing 2020 Sampling
This research was sponsored by the GVSU Student Summer Scholar Program through the Office of Undergraduate Research.
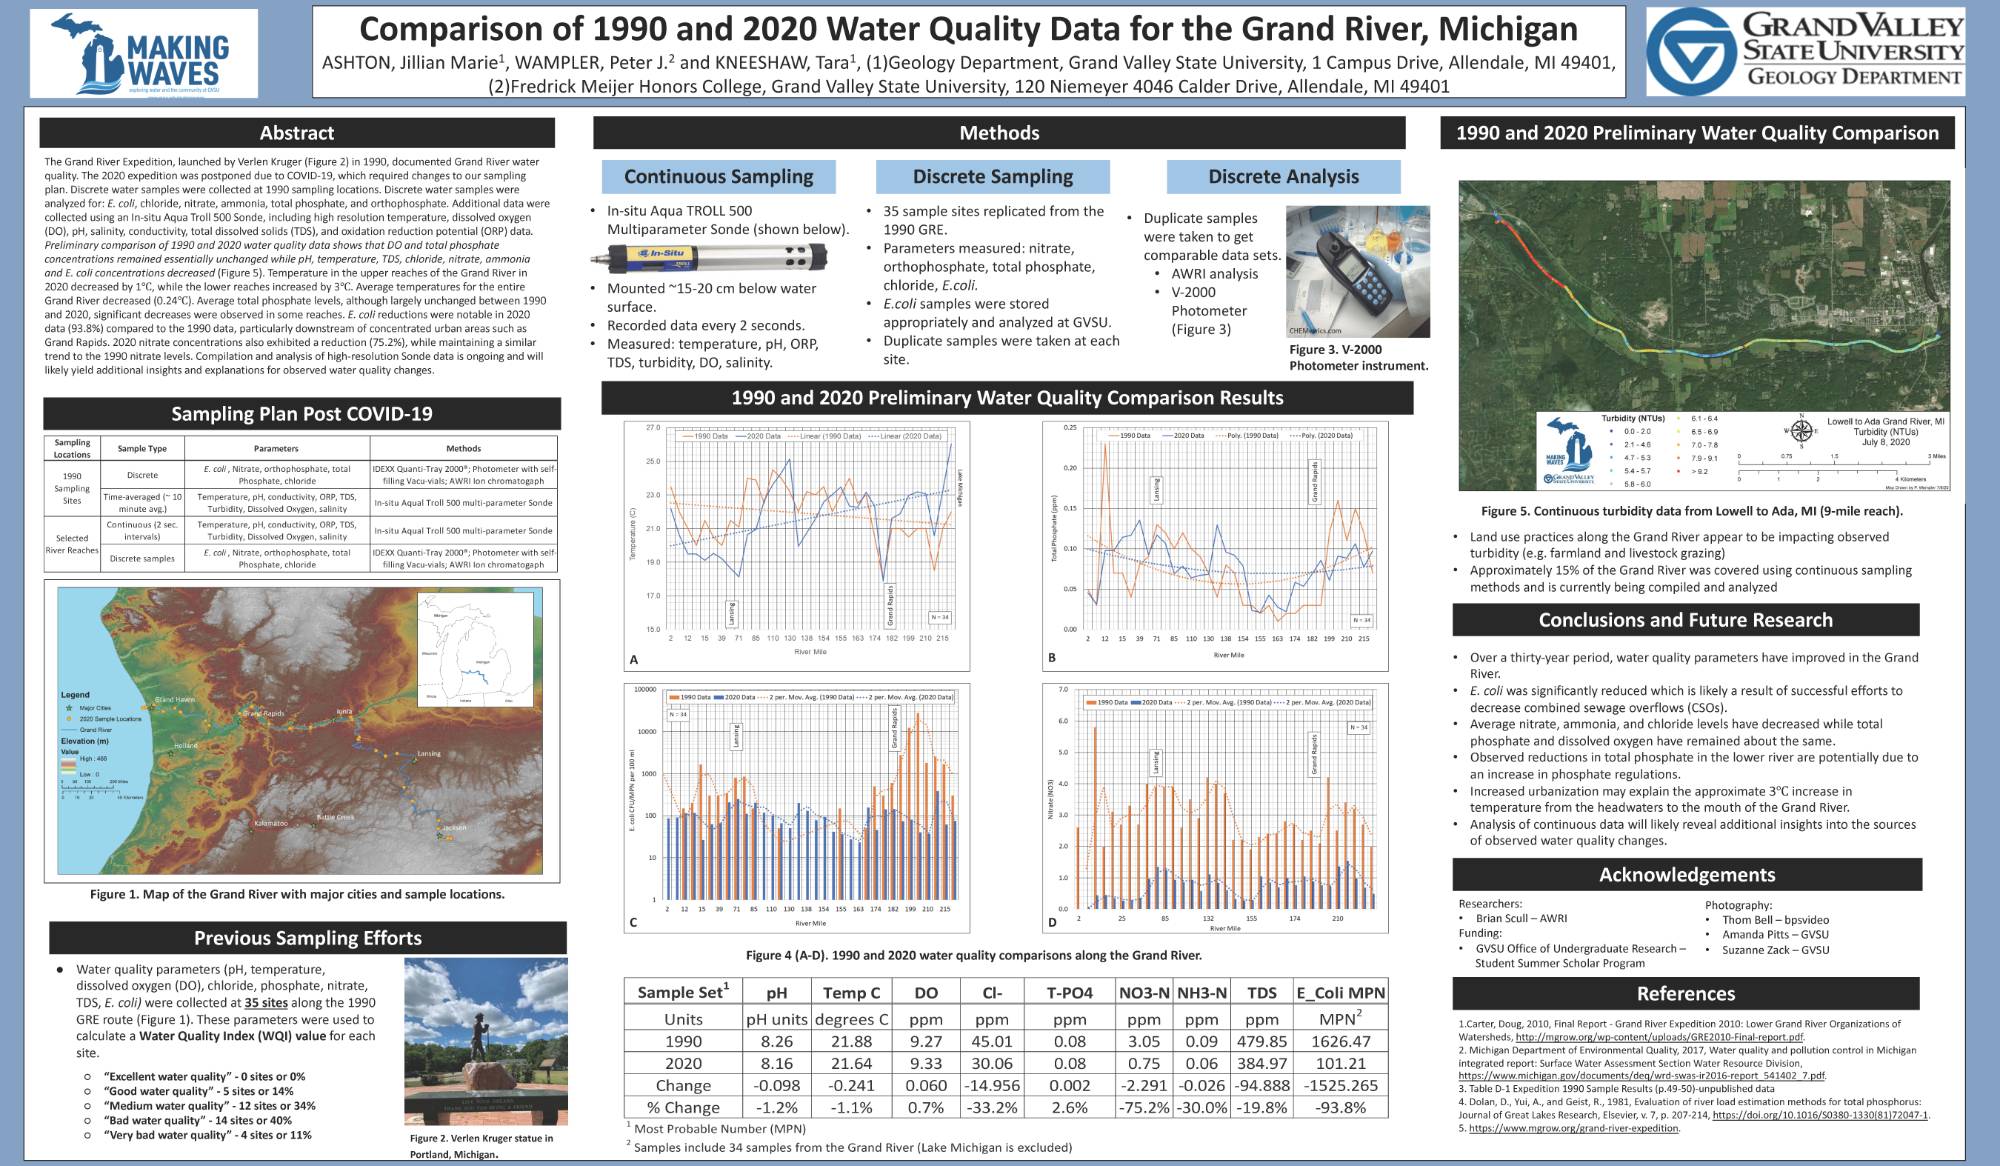
ABSTRACT: The Grand River (GR), Michigan’s longest river, stretches 422 km from the headwaters to the mouth. The Grand River Watershed (GRW) comprises 13% of the entire Lake Michigan drainage basin with a drainage area of 14,431 km2, the second largest drainage basin system in Michigan. The Grand River Expedition (GRE) launched by Verlen Kruger in 1990, documented GR water quality. The 2020 expedition was postponed due to COVID-19, which required changes to our sampling plan. The 2020 water quality sampling, originally planned for the 2020 GRE, was completed using a modified sampling plan and methods with the following goals: 1) collect a complete, multi-parameter, water quality dataset; 2) compare collected data to other available datasets to evaluate water quality changes spatially along the river and over time; and 3) make data available to the public, policy makers, and river managers to raise awareness of water quality issues in the GR. In the summer of 2020, discrete water samples were collected at 1990 sampling locations and analyzed for: E. coli, chloride, nitrate, ammonia, total phosphorous, and orthophosphate. Additional data were collected using an In-situ Aqua TROLL 500 Multiparameter Sonde, which provided high resolution temperature, dissolved oxygen (DO), pH, salinity, conductivity, total dissolved solids (TDS), and oxidation reduction potential (ORP) data. Preliminary comparison of 1990 and 2020 water quality data show that DO and total phosphorous concentrations remained essentially unchanged while pH, temperature, TDS, chloride, nitrate, ammonia and E. coli concentrations decreased. Average temperatures for the entire GR decreased (0.24℃) since 1990, with a decrease in temperature at the headwaters and an increase in temperature downstream of Grand Rapids. Average total phosphorous levels, although largely unchanged (+2.6%) between 1990 and 2020, significantly decreased in some reaches. E. coli reductions were notable in 2020 data compared to the 1990 data (-93.8%), particularly downstream of concentrated urban areas such as Grand Rapids. 2020 nitrate concentrations also exhibited a reduction (-75.2%), while maintaining a similar trend to the 1990 nitrate levels. Compilation and analysis of high-resolution Sonde data is ongoing and will likely yield additional insights and explanations for observed water quality changes.
The complete report including data and appendices can be downloaded here
Poster Version of Preliminary Results
Sites Sampled in 1990 Sampled again in 2020
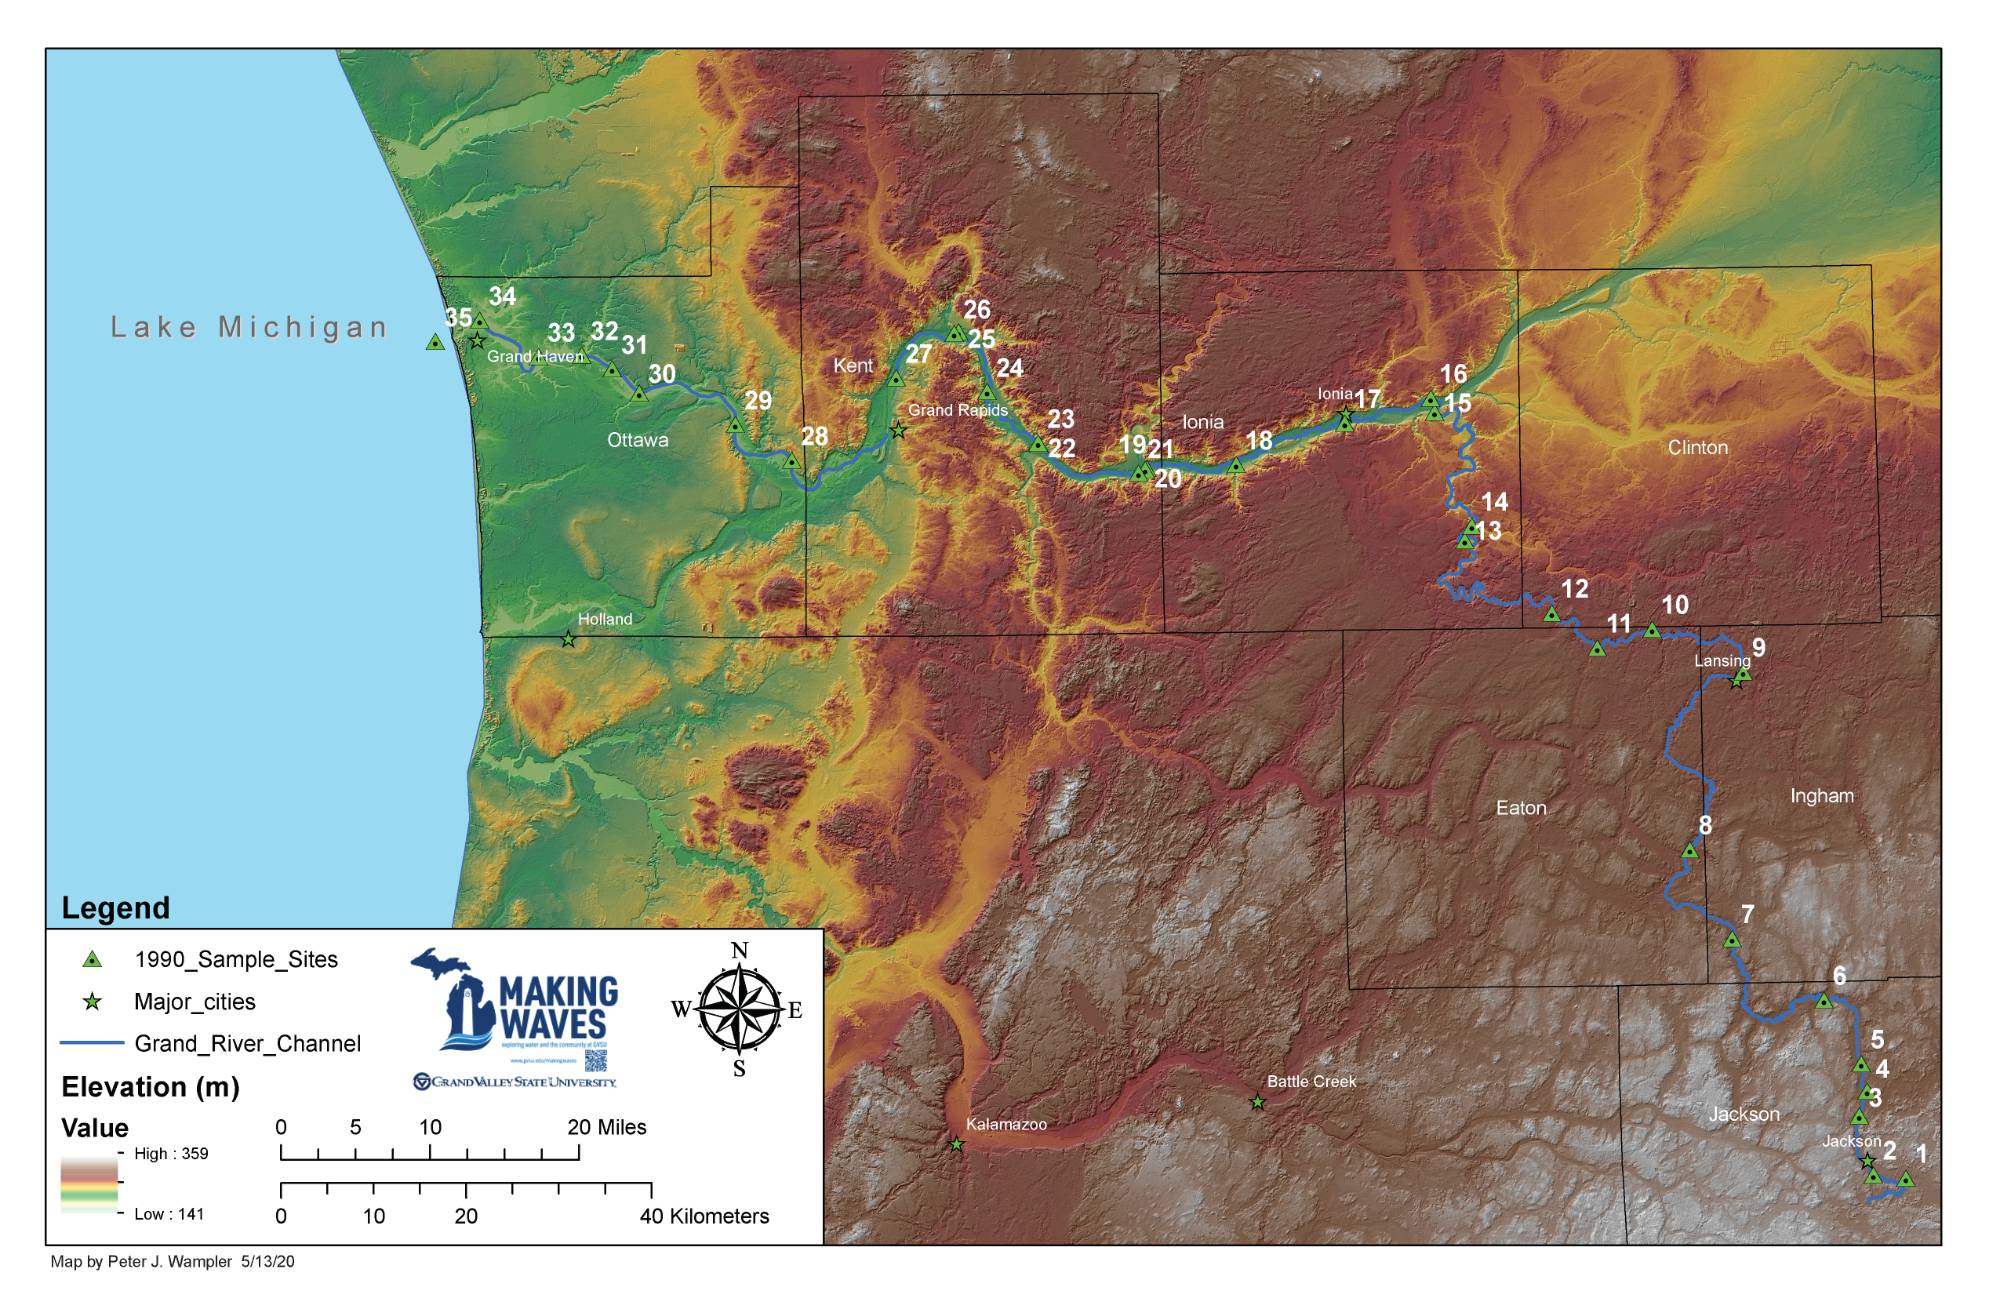
The numbers on this map represent the points where water samples and water quality data were collected in 1990. We are revisiting these sites in 2020 to collect water quality data.
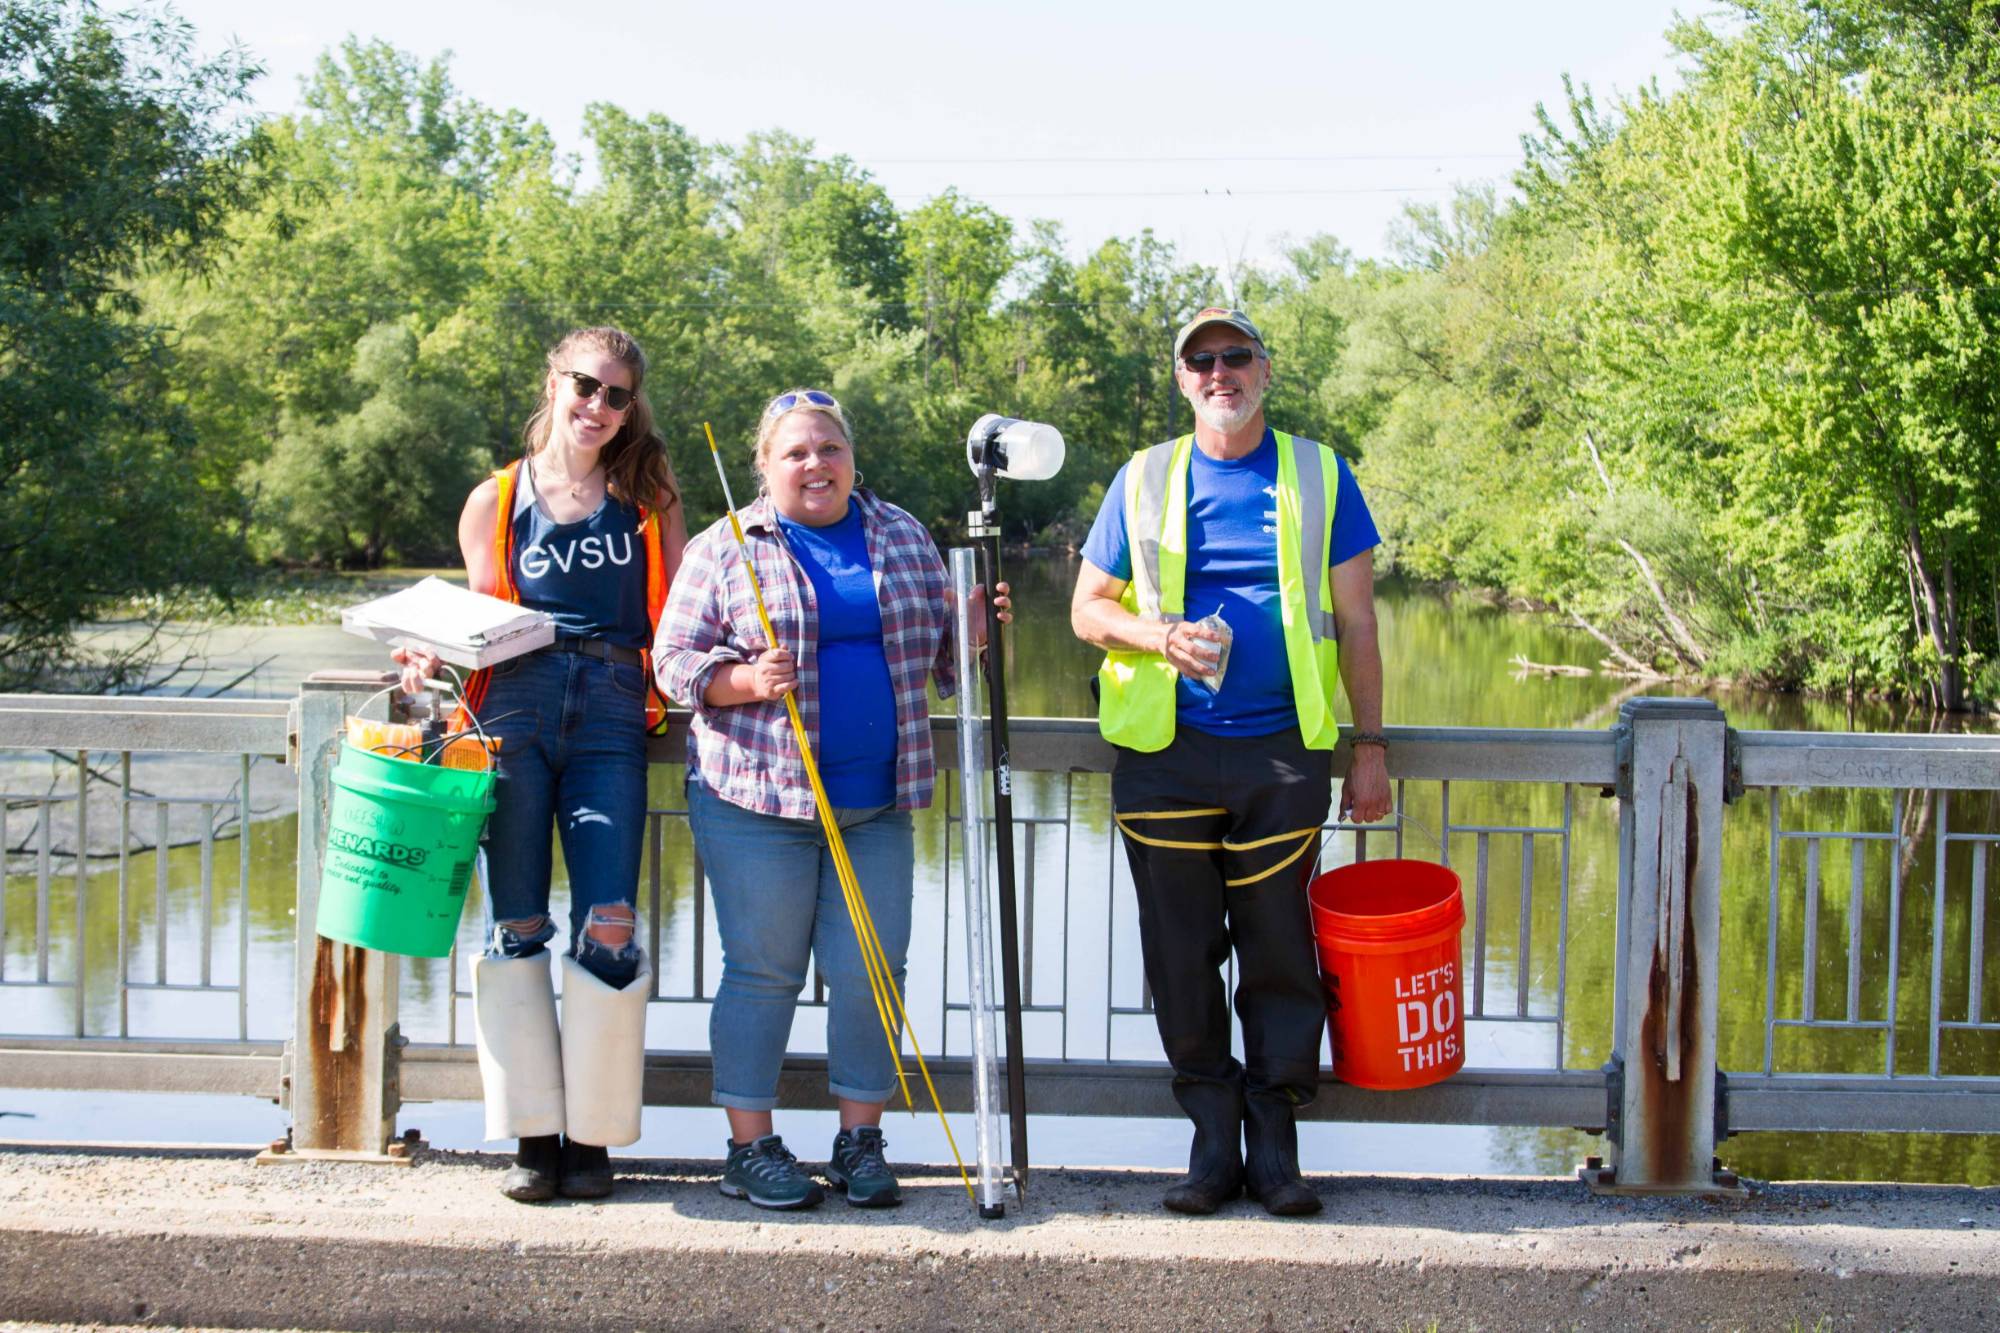
Sampling Crew (from left Jillian Ashton, Tara Kneeshaw, Peter Wampler)
In 1990 Verlen Kruger led the first ever Grand River Expedition (GRE) from the Headwaters of the Grand River to the Mouth. This expedition has been repeated every 10 years and was scheduled for 2020 until it was postponed due to the COVID-19 pandemic.
GVSU student Jillian Ashton, Dr Tara Kneeshaw, and Dr. Peter Wampler are sampling the entire river to compare current water quality to that observed in 1990. This research is funded by the Student Summer Scholar Program through the GVSU Office of Undergraduate Research.
Presentation for the Virtual LGROW Grand River Spring Forum entitled "Comprehensive Water Quality Sampling of the Grand River by Peter Wampler, GVSU, and Jillian Ashton, GVSU
Water Quality Measurements using an In-Situ Aqua Troll 500 Multiparameter Sonde
Probe Setup for collecting Water Quality Measurements
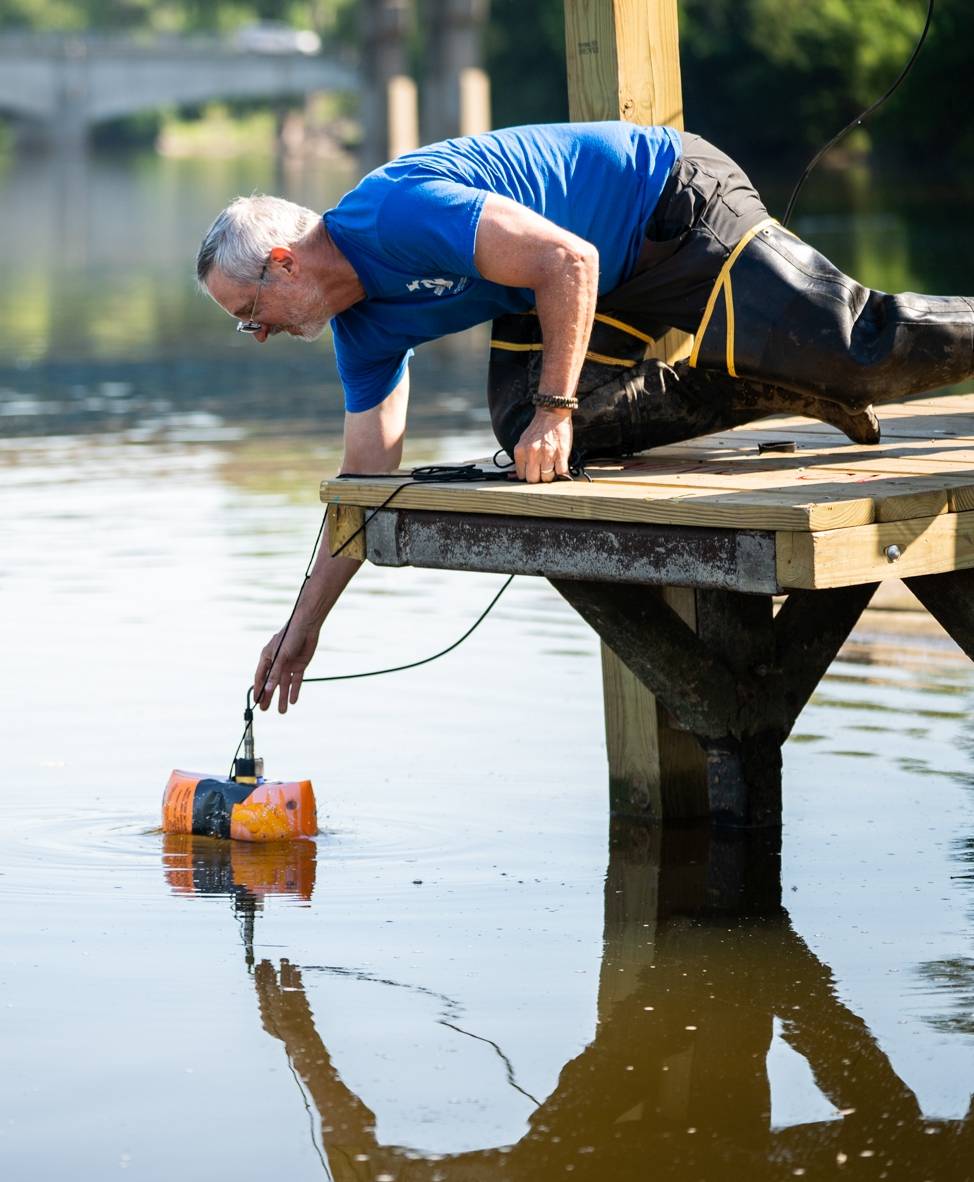
Photo Credit: Amanda Pitts
In-Situ Aqua Troll 500 Multiparameter Sonde
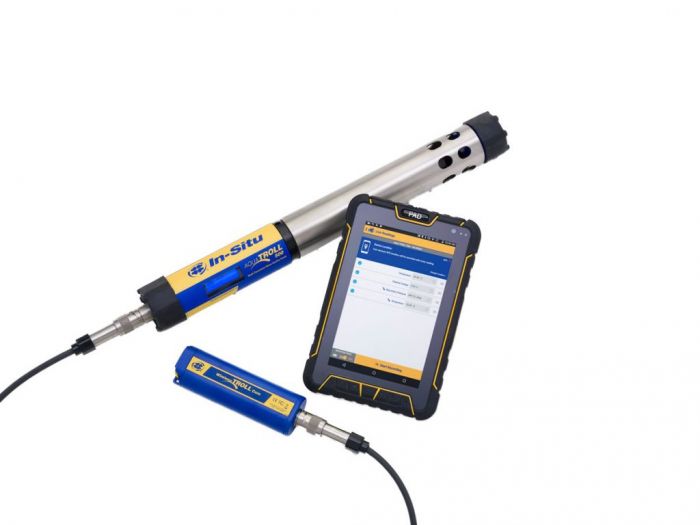
Several water quality parameters were collected using an In-Situ Water quality measurement device that is capable of taking multiple readings every two seconds. This device also records the probe location using the GPS on a smartphone. Parameters measured using the In-Situ Sonde included water temperature, Total Dissolved Solids (TDS), Conductivity, Specific Conductivity, Turbidity, Oxidation Reduction Potential (ORP), and Dissolved Oxygen (DO). Each of these parameters is summarized in the maps and graphs below.
Smartphone with In-Situ Data from the Aqua Troll 500
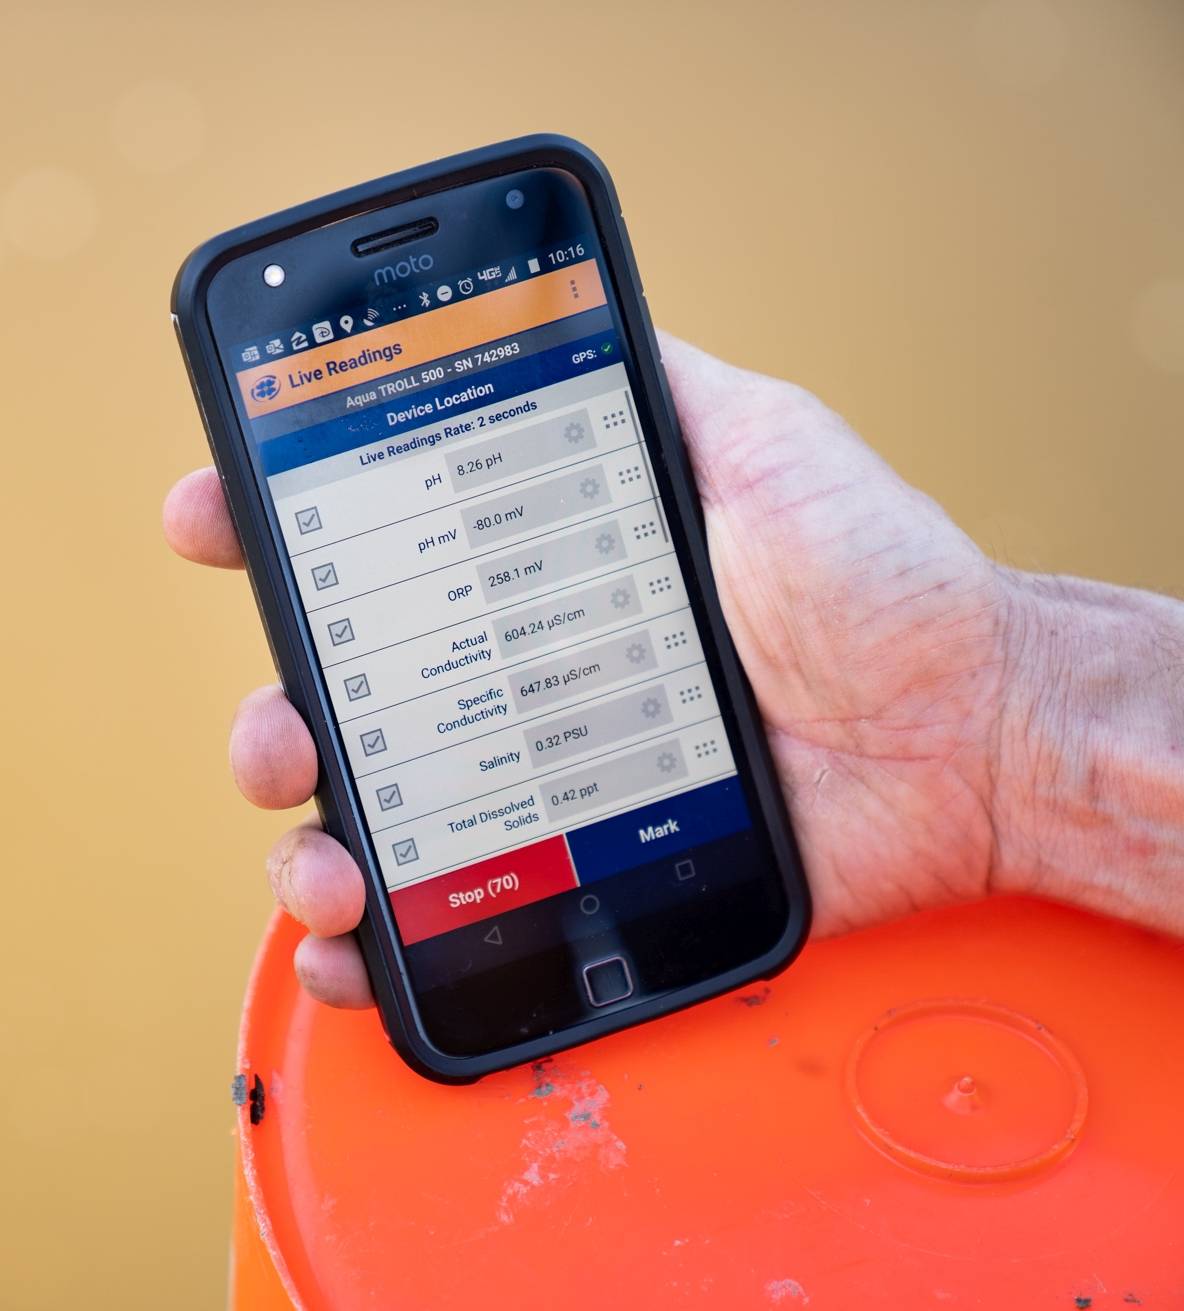
Photo Credit: Amanda Pitts