

Our data tells a story. What does your data say?
Dear Data @ GVSU invites all students, faculty, and staff to track data about one aspect of their daily life for a week, visualize that data on a postcard, and share it with the campus community. The postcards will be displayed at Student Scholars Day, April 8, 2026. Learn more about participating in Dear Data @ GVSU!
Faculty and Dear Data @ GVSU
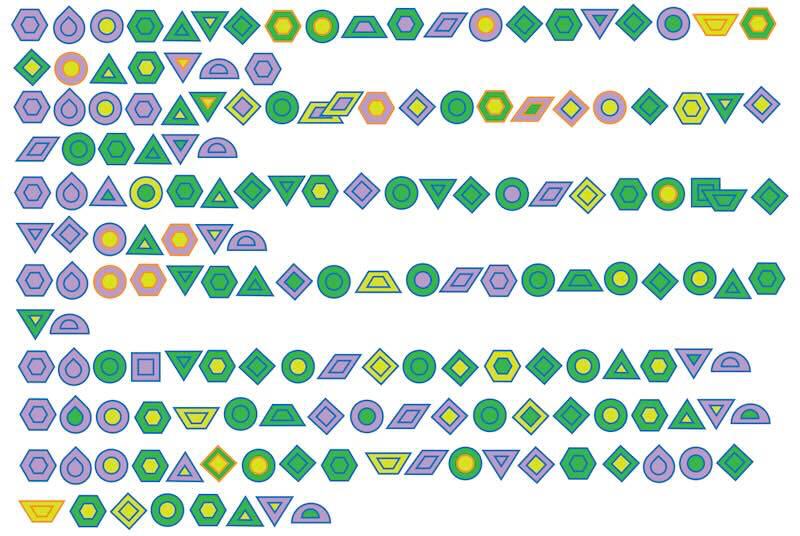
Professor Janelle Malagon uses Dear Data in their Digital Data and Design (DS 202) course. Dear Data "invites students to reimagine what 'data' can look like, and to recognize patterns in their own lives through data analysis." This data analysis is by student Kaitlyn Cooper and visualizes the activities, moods, and energy levels of a mother and one year old throughout a week.
Students and Dear Data @ GVSU
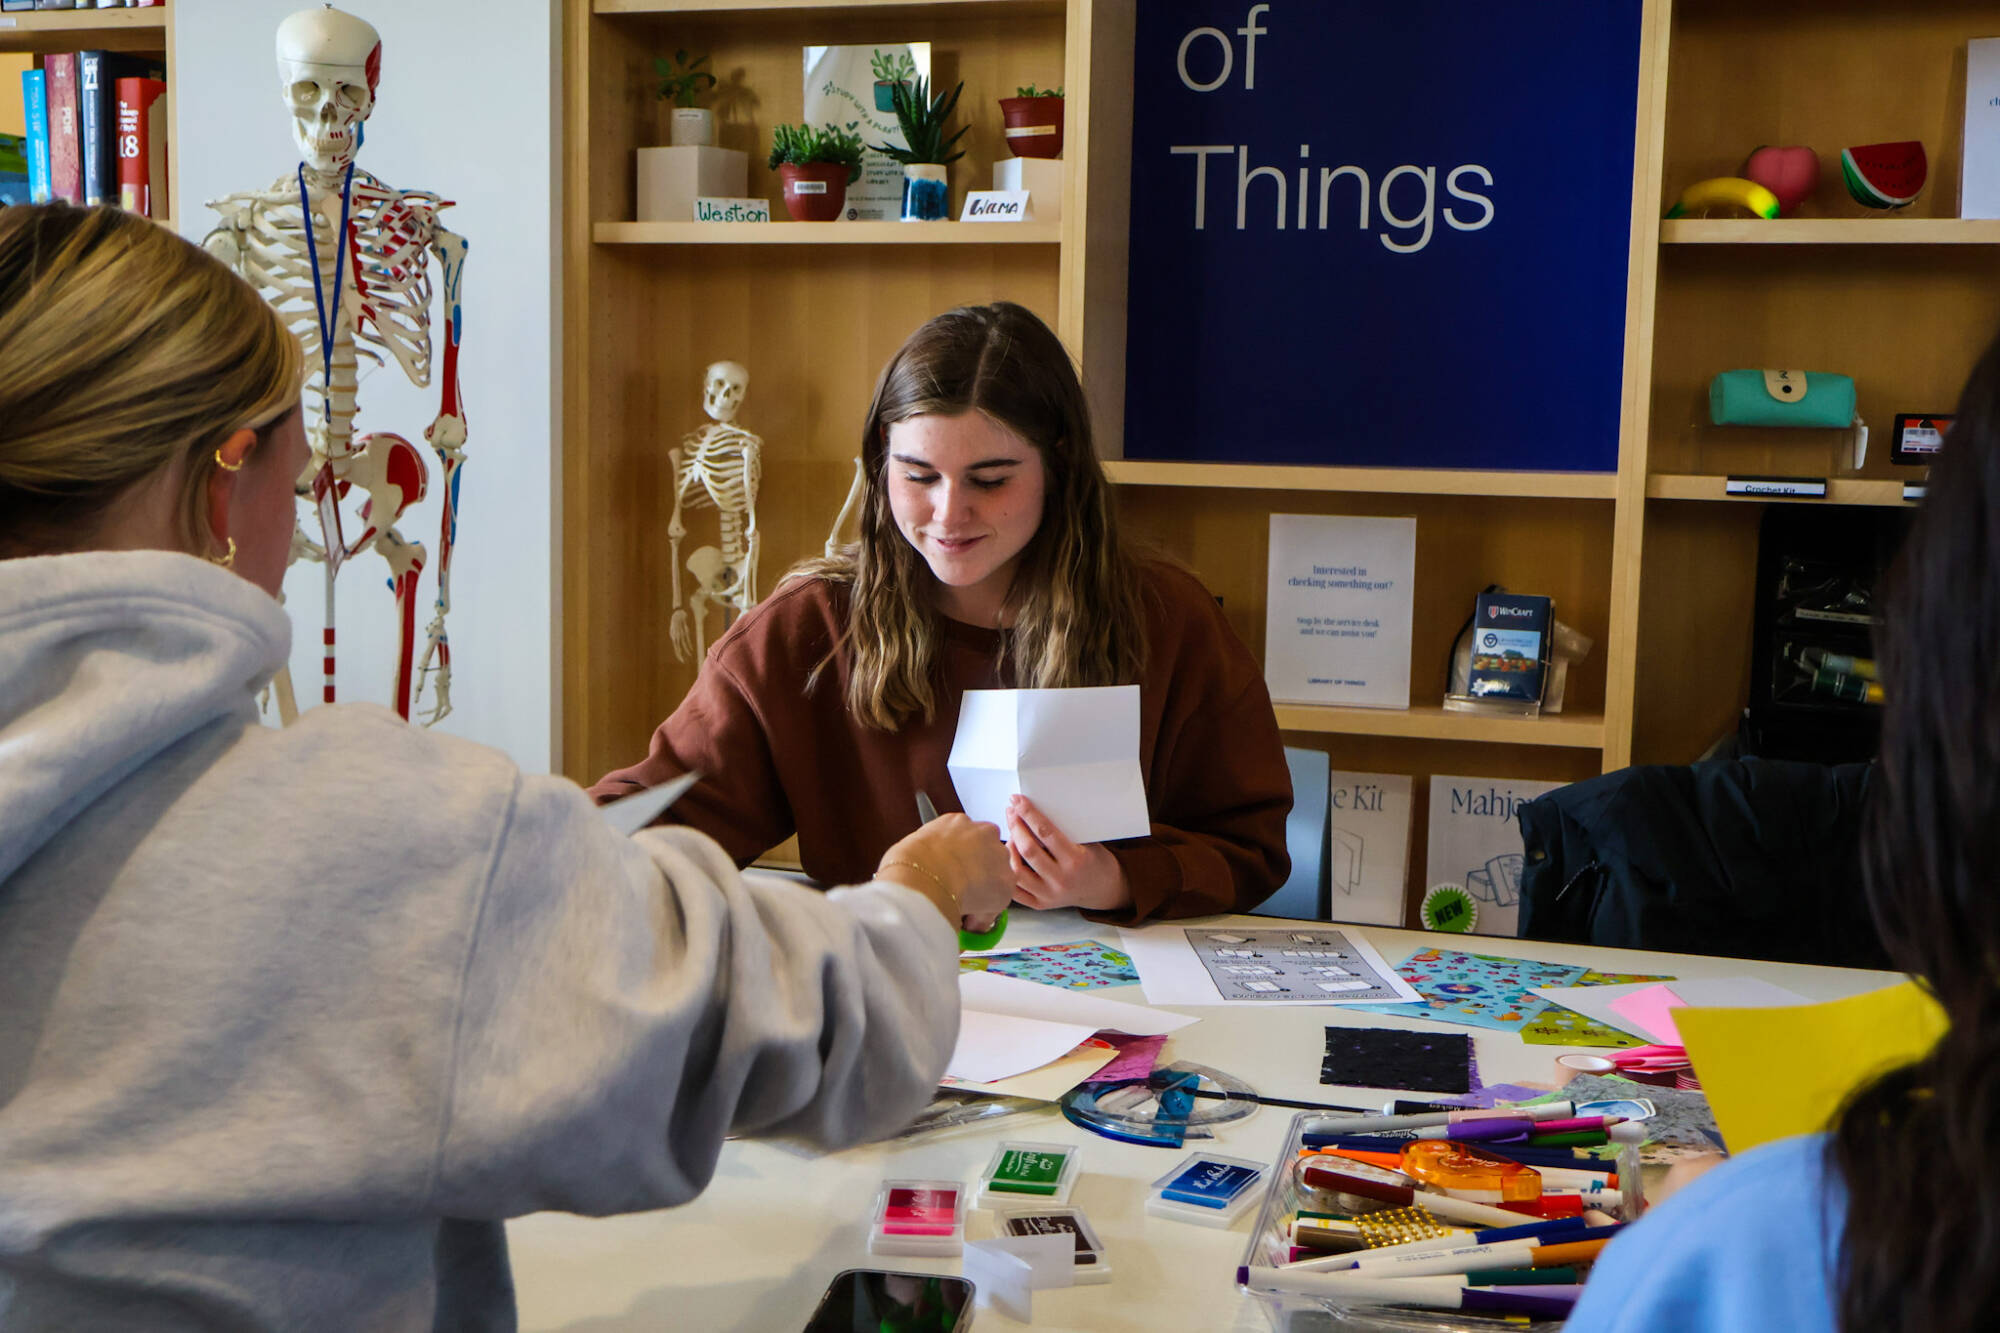
Students across campus are tracking one aspect of data in their lives and creating art to tell the story of that data. Anyone at GVSU can join!
–Information designers Giorgia Lupi and Stefanie Posavec, creators of Dear Data
What Can I Track?
Pick one part of your daily life to track—like your habits, emotions, conversations, or movement. You can choose any topic that interests you, such as “my week in music” or “my week of social media.” Other ideas include:
- Wildlife Sightings
- Distractions
- Food Eaten
- Time Spent with Others
- Books Read
- Walks Taken
- Social Media
- You can track anything!
The Lanthorn recently profiled Librarian Hazel McClure as she tracked a week of laughter as part of Dear Data @ GVSU.
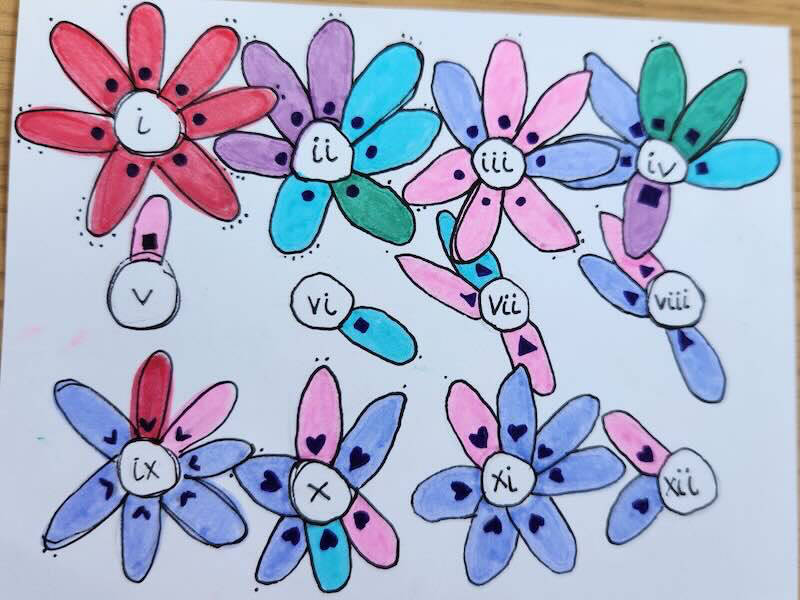
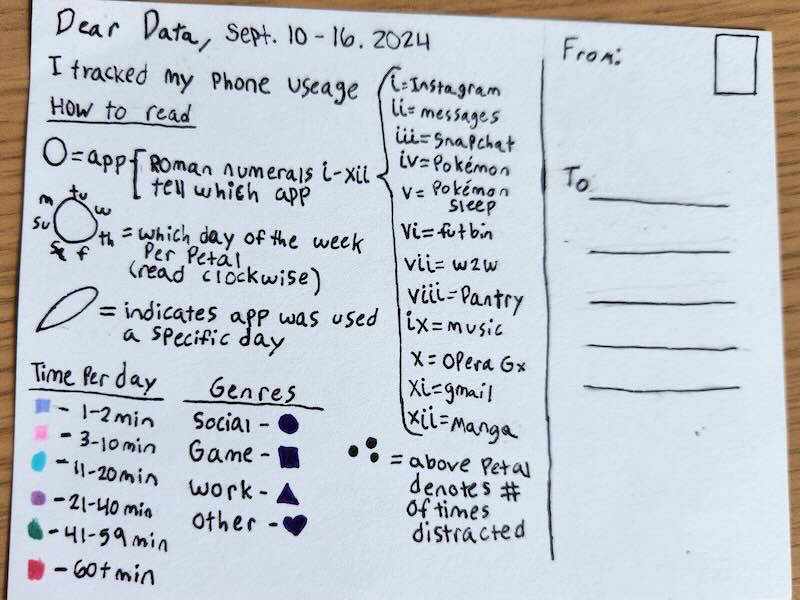
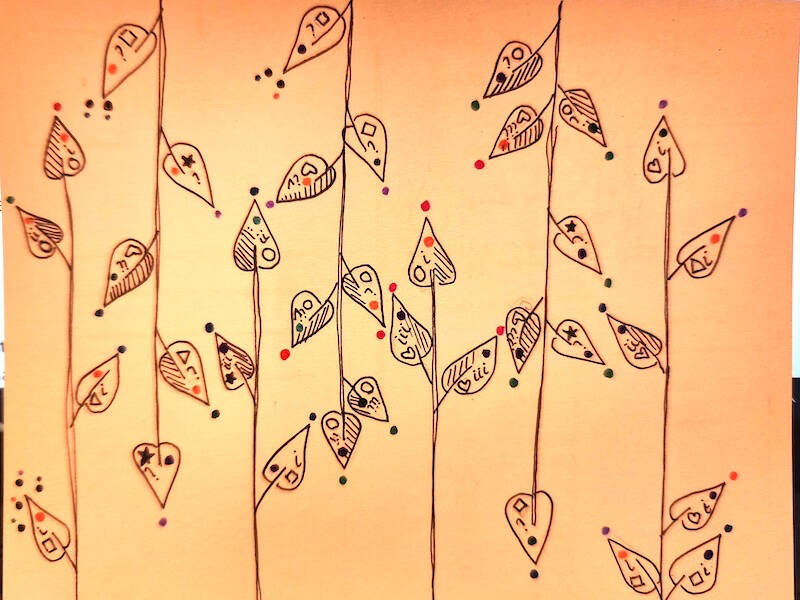
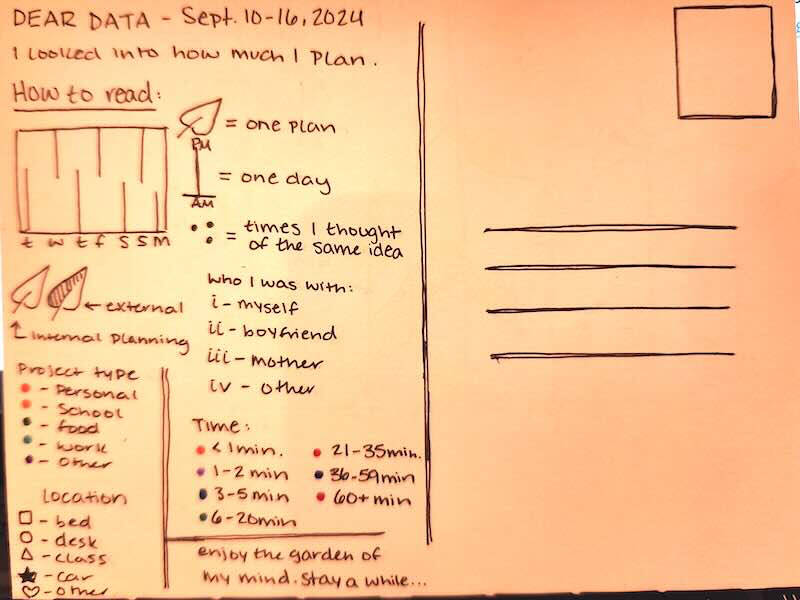
Example postcards
Step 1: Choose a Topic
Pick one part of your daily life to track—like your habits, emotions, conversations, or movement. You can choose any topic that interests you, like the examples above.
Step 2: Track Your Week
Track your topic for one week. Write down details like how often something happens, when it happens, or where you are. The days don’t have to be in a row.
Step 3: Get a Postcard
You can pick up a paper postcard template at the Mary Idema Pew Library or the Steelcase Library or create your own digital postcard. All postcards should be 4x6 inches.
Step 4: Draw your Data
Turn your notes into a drawing on a 4x6 postcard. Use colors, shapes, or symbols to show the patterns you found. On the back, include a short key that explains what everything means. Try to be creative and think beyond simple bar or pie charts.
Step 5: Submit your Postcard
Submit your postcard at the Front Desk of any GVSU Library location by March 26, 2026. If you made a digital postcard, upload it using the online submission form. You may sign your first name or initials, but please avoid including your full name. Postcard submissions will be displayed on Student Scholars Day and preserved in the University Archives.
Why Participate?
Discover something new
You might notice patterns in your daily life that you never paid attention to before. Tracking your week can help you learn something new about yourself.
Slow down and notice more
This project encourages you to pause and take a closer look at everyday moments. It’s a simple way to reflect on your day and be more mindful.
Have fun and be expressive
There’s no right or wrong way to draw your data. Use colors, shapes, and your own style to turn information into a piece of art.
Attend a Dear Data @ GVSU Event
Dear Data @ GVSU Kick Off Events - January 14 and Jan. 15, 4:00 PM - 6:00 PM
Join us at the Kick-off celebrations on Wednesday, January 14 and Thursday, January 15, 2026. Share your topic, plan how to collect data, and grab materials (postcards, markers, etc.). Not sure what topic you want to explore? The Dear Data @ GVSU Team will be there for brainstorming and data collection tips.
Meet Up Event – February 10, 2026, 4:00 PM - 7:00 PM
All are welcome and encouraged to attend the Dear Data @ GVSU Meet Up. You can learn more about the submission process or simply make time to draw and illustrate.
Dear Data @ GVSU Celebration and Exhibition on Student Scholars Day – April 8 at 4:00 PM
We’ll wrap up the project with a celebration and public display of all submitted postcards in the library. Light refreshments will be provided.
The deadline for postcard submissions is March 26, 2026. Postcards can be submitted digitally or in physical form.
What is Dear Data?
Dear Data is, at its core, a practice of slow data transmission, and an invitation to pause, reflect, and connect with others through the patterns of our everyday lives.
Over the course of one year, designers Giorgia Lupi and Stefanie Posavec got to know each other by exchanging weekly postcards between the UK and the US. Each postcard featured a hand-drawn visualization of personal data they had agreed to collect during the week. For instance, one week they tracked every time they said “thank you.” Another, they tracked their “interactions with strangers” or the “sounds” they noticed. Each postcard explored a different topic, with the visualization on the front and a detailed legend on the back.
What began as a personal exchange became a global phenomenon—Dear Data is now a 300-page book and part of the permanent collection at the Museum of Modern Art.
The Digital Studies Program , the Office of Undergraduate Research and Scholarship, and the University Libraries invite the campus community to join Dear Data @ GVSU, a collective data design activity inspired by information designers Giorgia Lupi’s and Stefanie Posavec’s “Dear Data” project.