Muskegon Lake Water Quality Dashboard
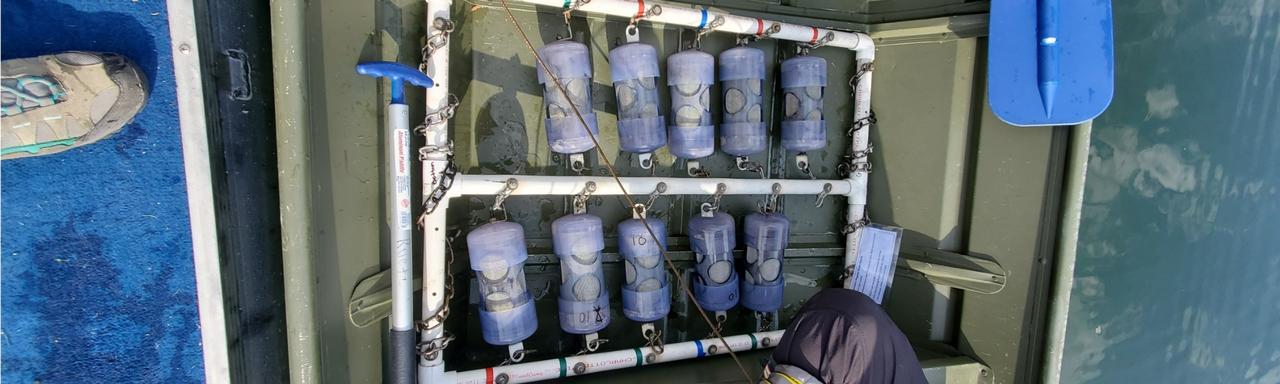
The Muskegon Lake Long-Term Monitoring Program began in 2003, in an effort to observe and document changes in the ecological health of Muskegon Lake and provide the data needed to remove Muskegon Lake from the list of Great Lakes Areas of Concern (AOC). Based in part on the data collected as part of this monitoring program, we are delighted to announce that Muskegon Lake was officially de-listed on October 1st, 2025. It is important that lake monitoring continue to assess its status moving forward and identify any new issues that may emerge. As part of the program, the lake is sampled 3 times per year at 6 sites for a suite of biological, physical, and chemical parameters. Support for the project is provided, in part, through the William G. Jackson Muskegon Lake Research Fund held at the Community Foundation for Muskegon County.
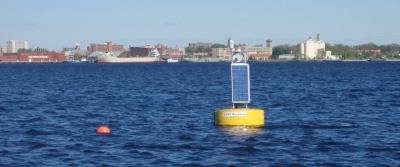
As a complement to the long-term monitoring program, the Muskegon Lake Observatory was established in 2011. The observatory consists of a buoy system that collects continuous water quality, hydrology, and meteorological data during the ice-free period.
Key water quality indicators were selected from these datasets to create a water quality dashboard for Muskegon Lake. The goal of the dashboard is to provide a visual representation of the current status and historical trends in Muskegon Lake water quality, by rating each indicator along a scale from desirable (green) to undesirable (red) conditions. Each scale also includes a category that indicates the water quality goal for the lake is being met (yellow).
We selected dashboard indicators that are commonly used to assess water quality and are relevant to AOC delisting: total phosphorus (TP), chlorophyll a, Secchi disk depth, and dissolved oxygen. Each indicator is described in more detail below.
COVID-19 restrictions prevented spring water quality sampling in early May 2020 and delayed the deployment of the Muskegon Lake Observatory Buoy until August 2020. In the past, we presented annual averages for the three seasons that we sample; since 2020, we have presented the dashboard as seasonal averages (spring, summer, and fall) across sites to reveal the changes over time in the lake and provide greater detail on lake changes. When dashboard data are organized by season, the influence of spring data on annual means (as shown in prior dashboards) is revealed. For example, lower TP and chlorophyll a values in spring offset the higher TP values in summer and fall when averaged over the entire sampling season, obscuring the seasonal differences; conversely, the deeper Secchi disk values in spring (i.e., clearer water) counter the shallower summer and fall seasonal depths (i.e., more turbid water).
The 2025 data indicate that Muskegon Lake’s annual water quality is attaining good ecological health, with annual means either being just outside of goal thresholds or meeting goals. While our long-term monitoring program provides useful information to evaluate lake water quality trends over time, the limited sampling effort (6 sites, 3×/yr) can miss important episodic events. For example, very intense harmful algal blooms formed in Muskegon Lake in fall 2021 and 2023, which were not captured as part of the long-term monitoring work. However, 2024 TP concentrations and the resulting algae bloom were strong enough to sustain throughout the summer and into the fall. The lake’s ecological health, while certainly improved from the industrial era (Steinman et al. 2008; Liu et al. 2018), still has room for improvement, especially with respect to occasional algal blooms.
Total Phosphorus
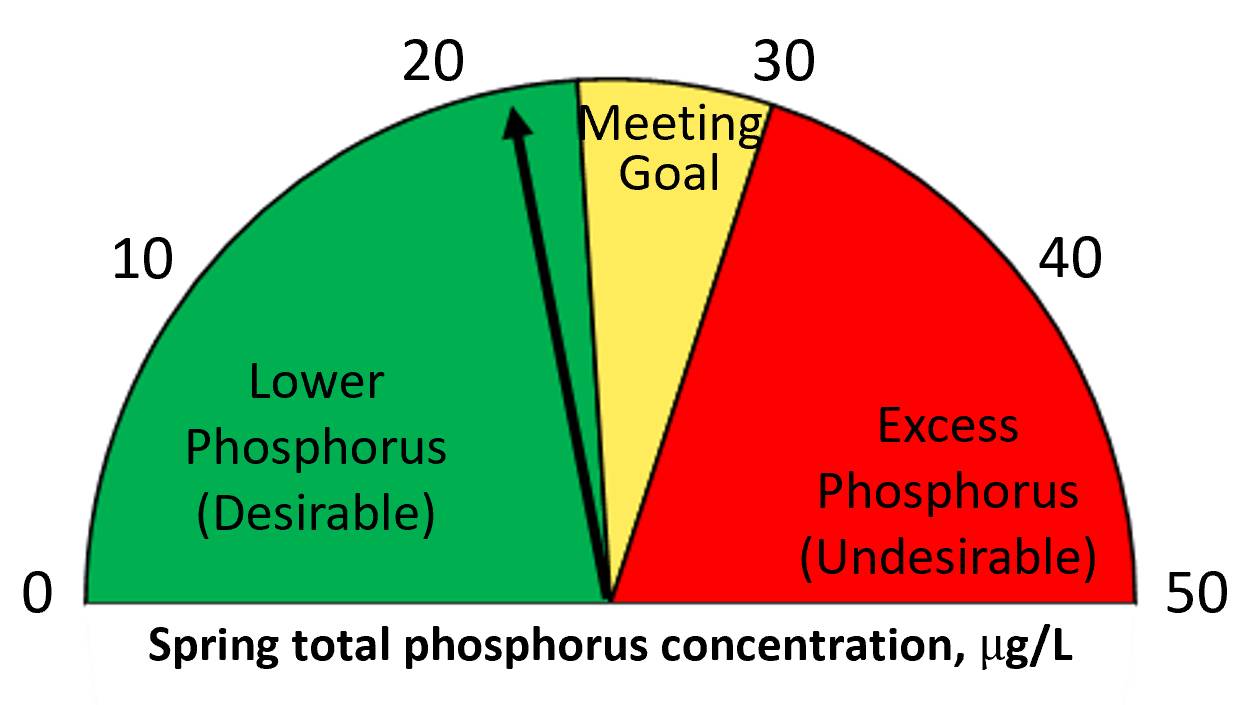
Target Concentration: 30 µg/L
Current Status
2025
Historical Status
1972, 2003-2025
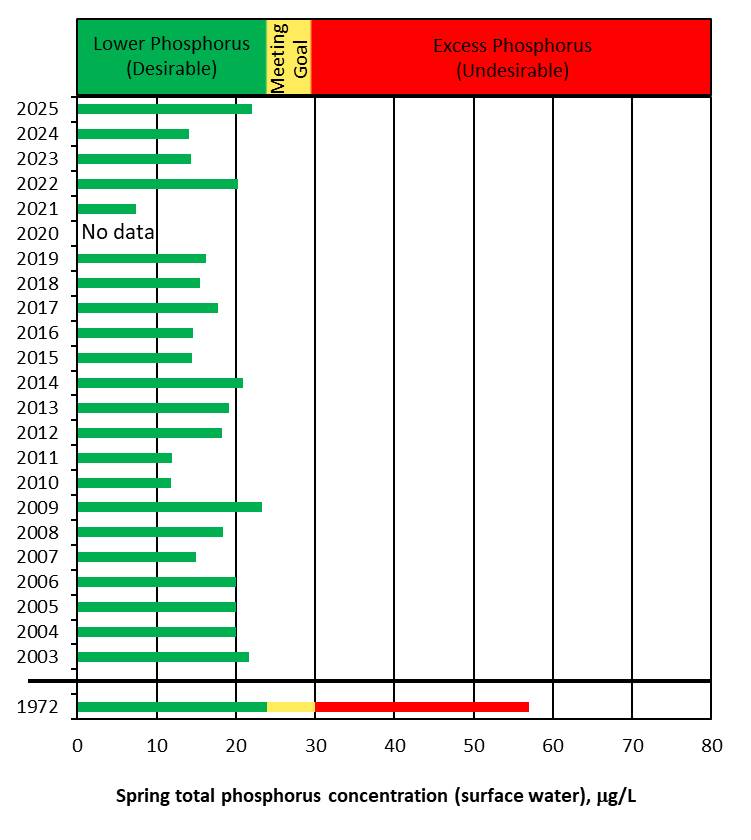
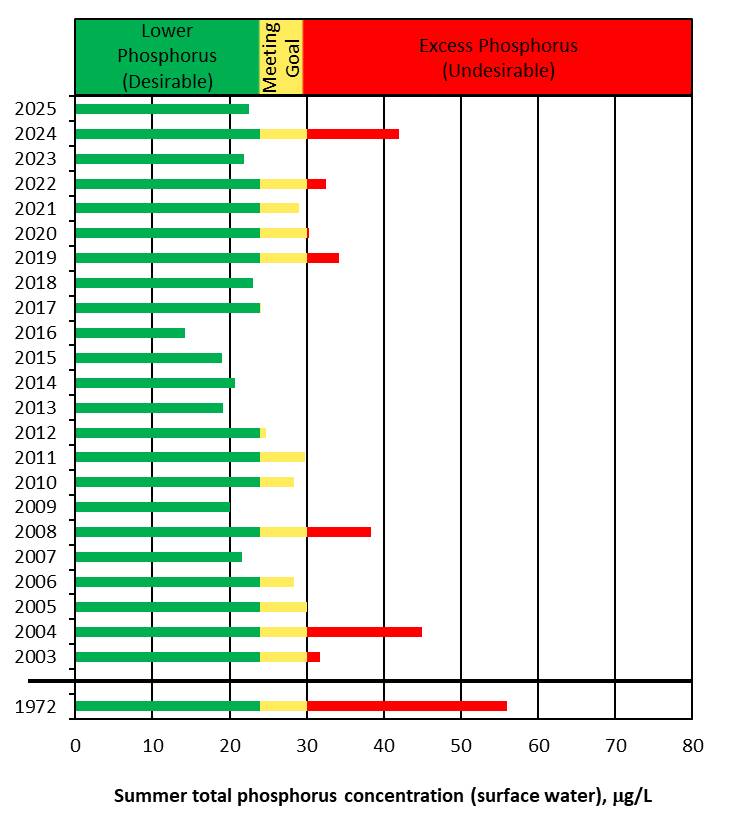
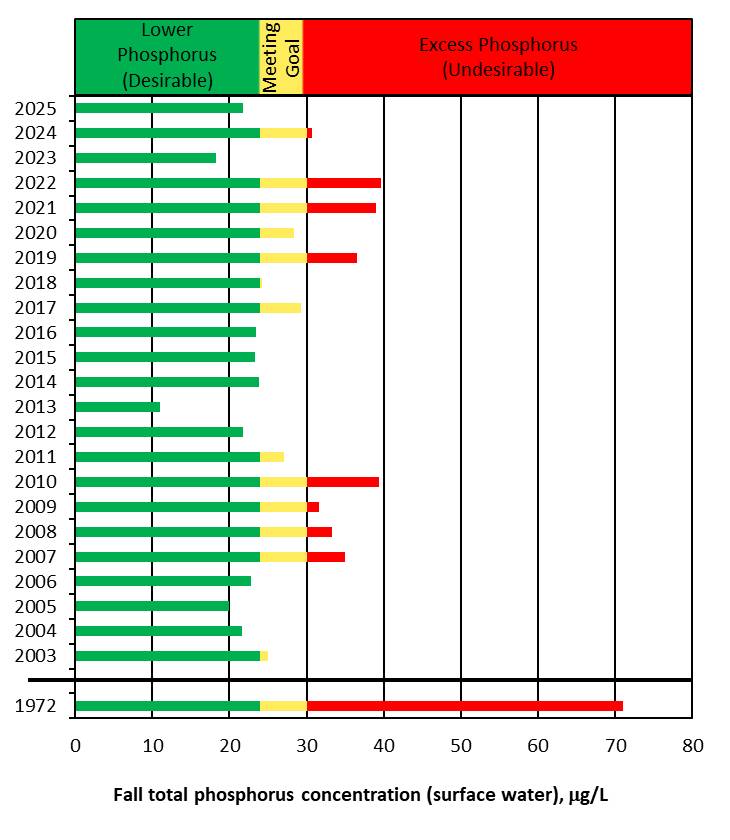
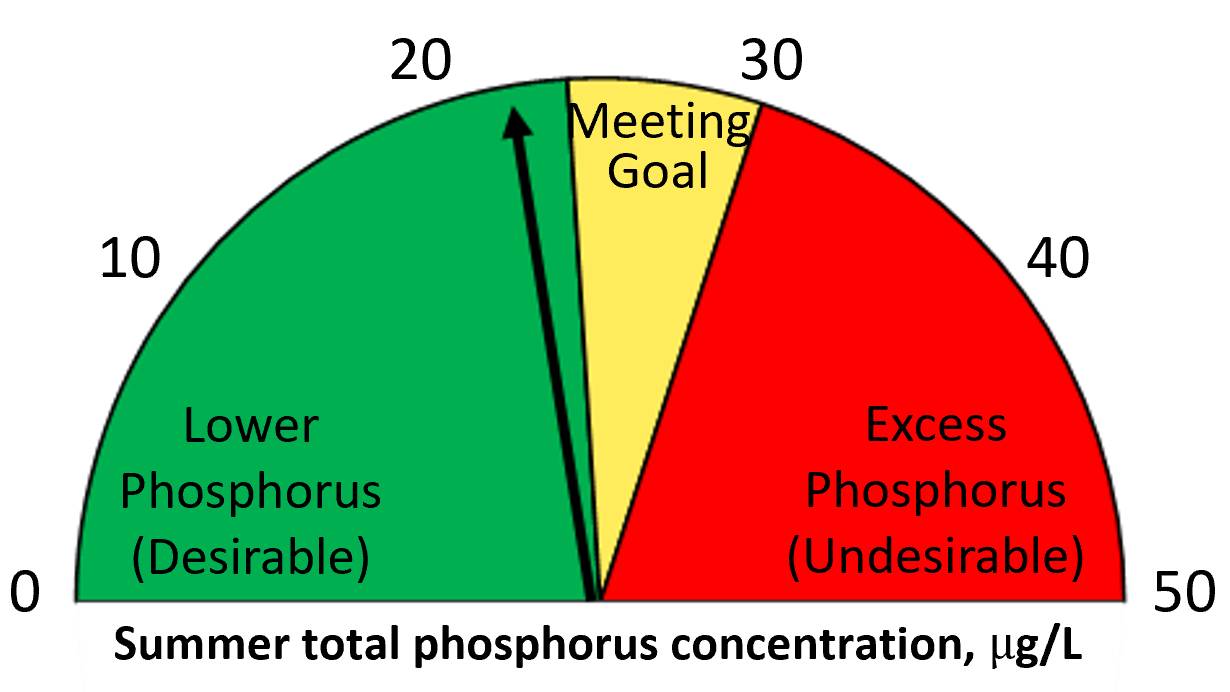
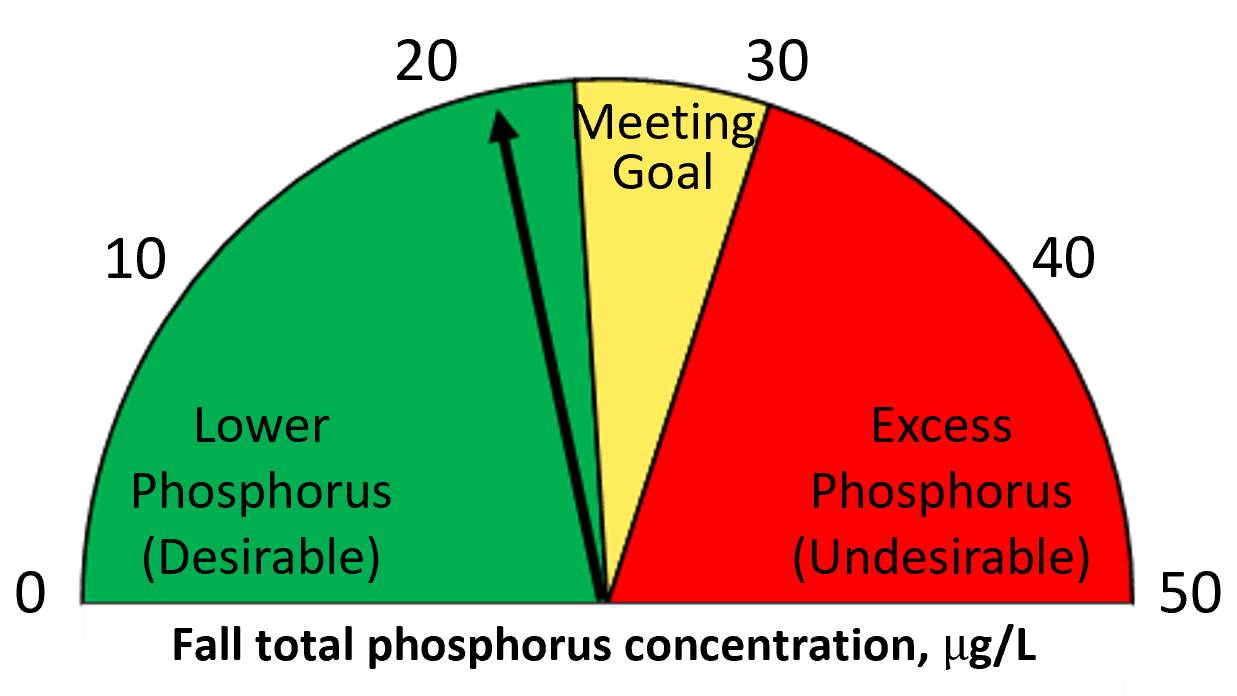
As one of the key nutrients that fuels algal growth, phosphorus concentration can indicate the potential for a lake to sustain undesirable algal blooms. The phosphorus dashboard was created by calculating seasonal average TP concentrations measured in the near-surface water of the 6 long-term monitoring stations. Historical data collected by the US EPA (Freedman et al. 1979) are included as a reference point for historical conditions.
Spring TP continued a long-term trend and remained in the Desirable threshold. Although concentrations across individual sites and seasons varied slightly throughout 2025, TP was Desirable during each sampling event and showed improvement from 2024 in the summer and fall.
Data sources: Freedman et al. (1979); Muskegon Lake Long-term Monitoring Program, Steinman et al. (2008) and AWRI (unpublished data)
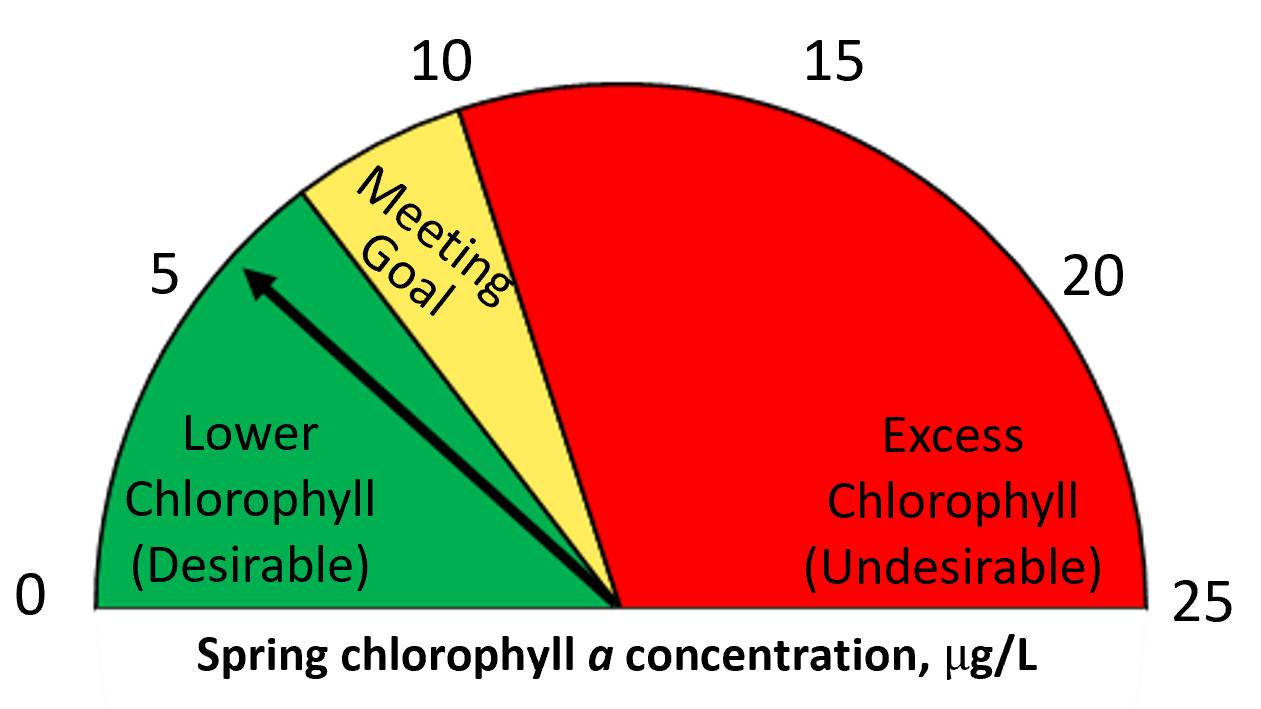
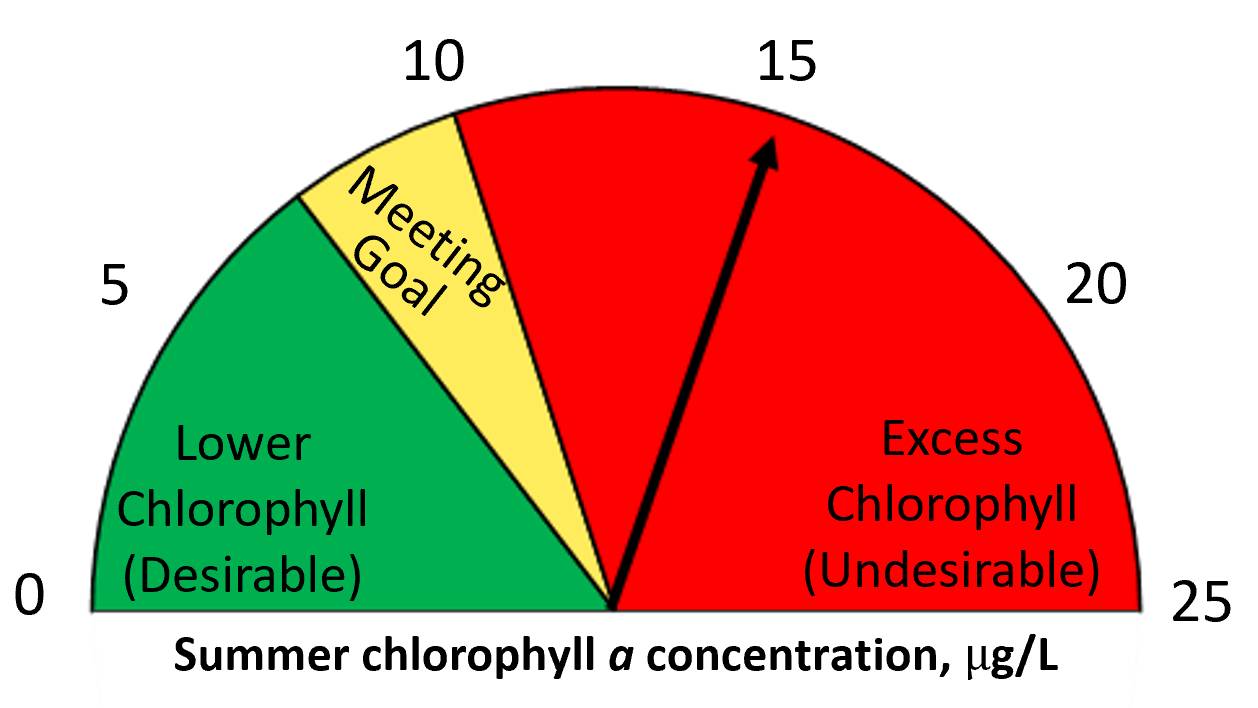
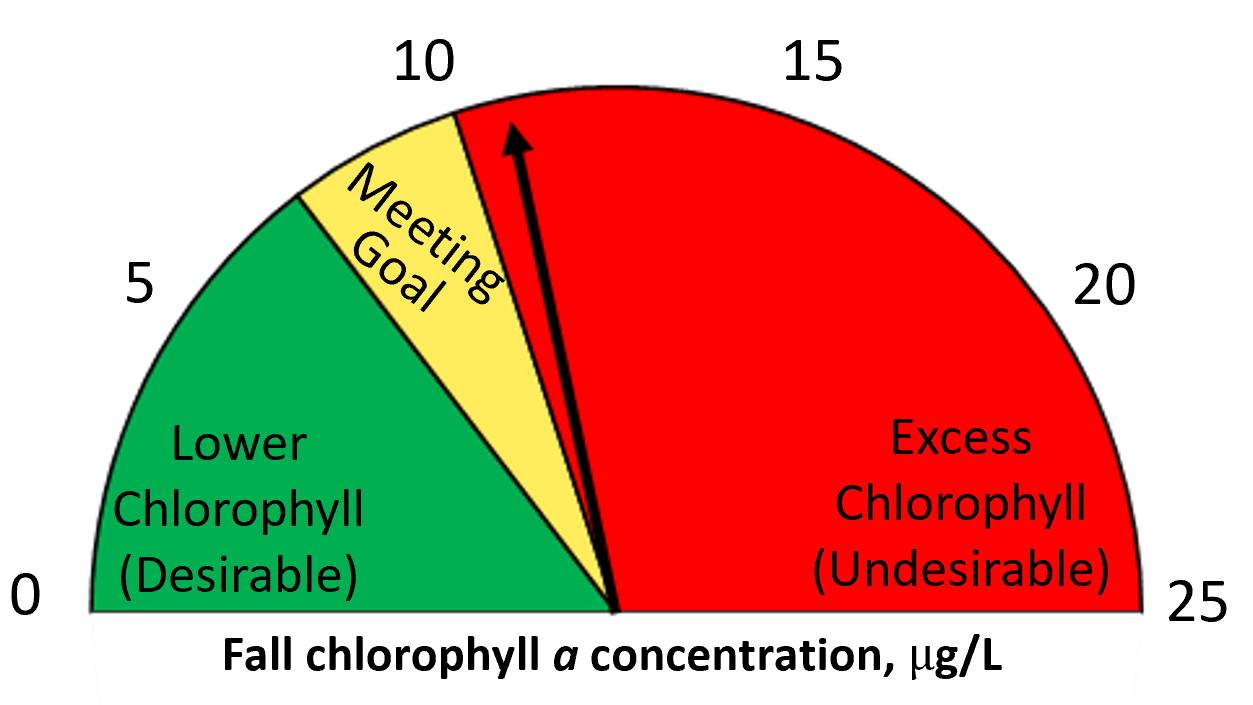
Chlorophyll a
Target Concentration: 10 µg/L
Current Status
2025
Historical Status
1972, 2003-2025
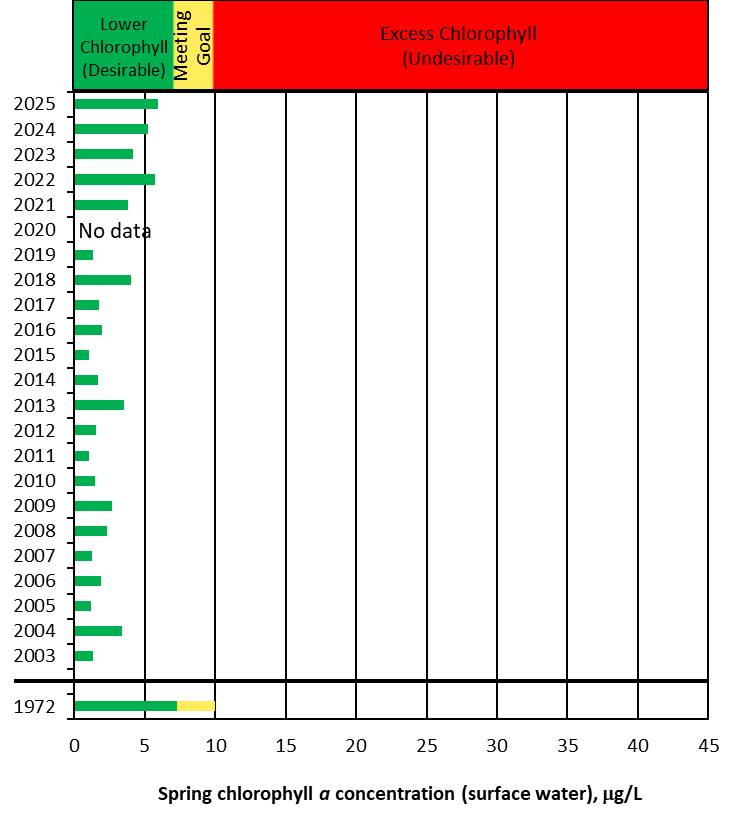
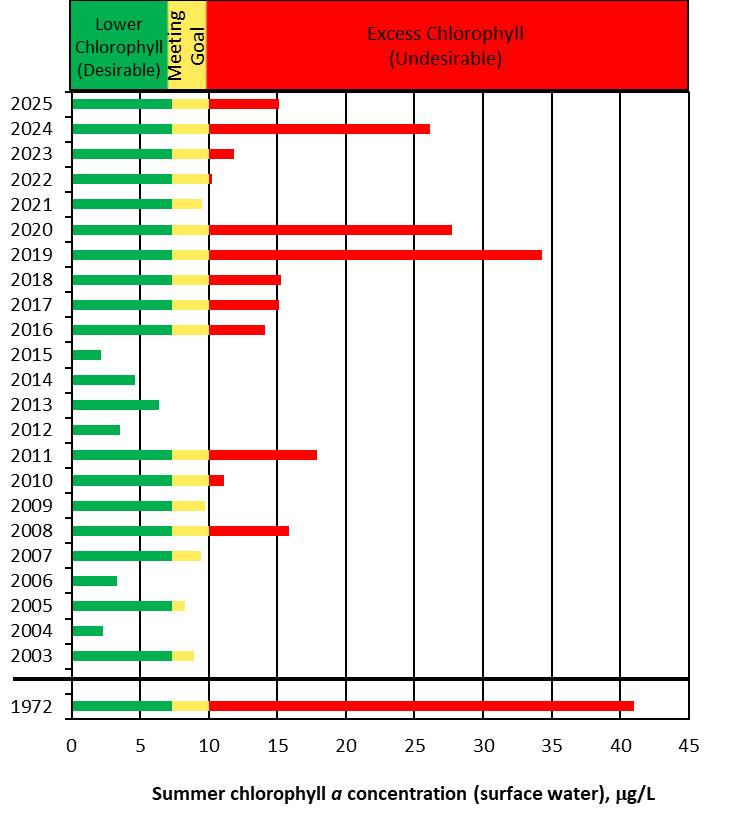
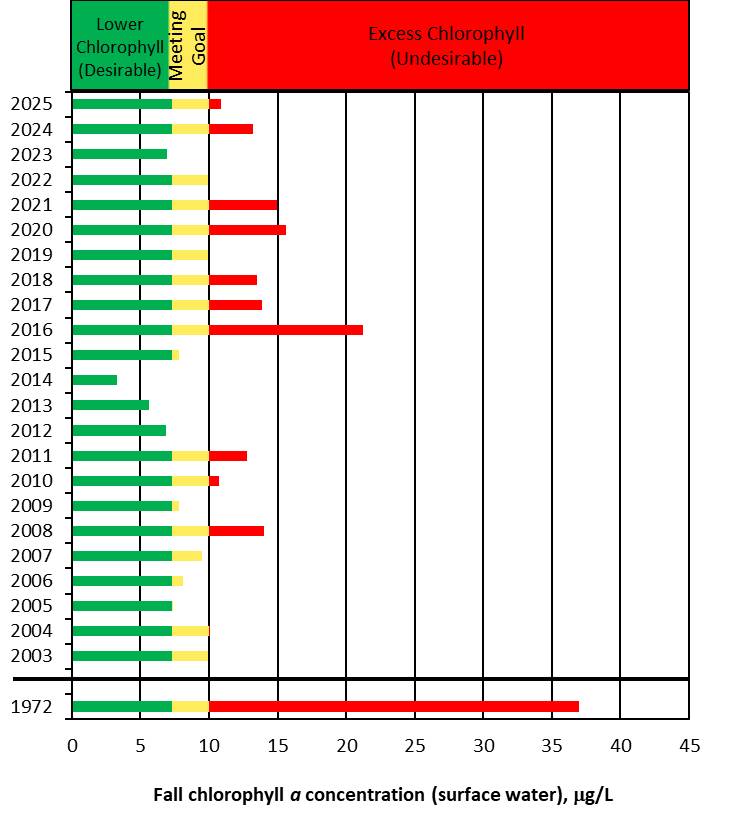
Chlorophyll a is the green pigment found in photosynthetic algae. Chlorophyll a serves as a proxy for the amount of algal biomass present in water. The chlorophyll a dashboard was created by calculating seasonal average chlorophyll a concentrations measured in the surface water of the 6 long-term monitoring stations. Historical data collected by the US EPA (Freedman et al. 1979) are included as a reference point for historical conditions.
Similar to the TP data, spring mean chlorophyll a concentrations were low and in the Desirable range. Chl a concentrations increased from the spring, which is a typical phenomenon in Muskegon Lake. Although summer Chl a was an Undesirable concentration and averaged ~15 µg/L, the value was much lower than in 2024. The summer value was influenced by the high reading at the Ruddiman monitoring site (~24 µg/L); if removed, Chl a in the rest of the lake ranged 12-14 µg/L. Fall concentrations remained Undesirable, but the fall mean decreased from summer thanks to the influence of the Muskegon River site (6.7 µg/L).
Data sources: Freedman et al. (1979); Muskegon Lake Long-term Monitoring Program, Steinman et al. (2008) and AWRI (unpublished data)
Secchi Disk Depth (Water Clarity)
Target Depth: 2.0 m
Current Status
2025
Historical Status
1972, 2003-2025
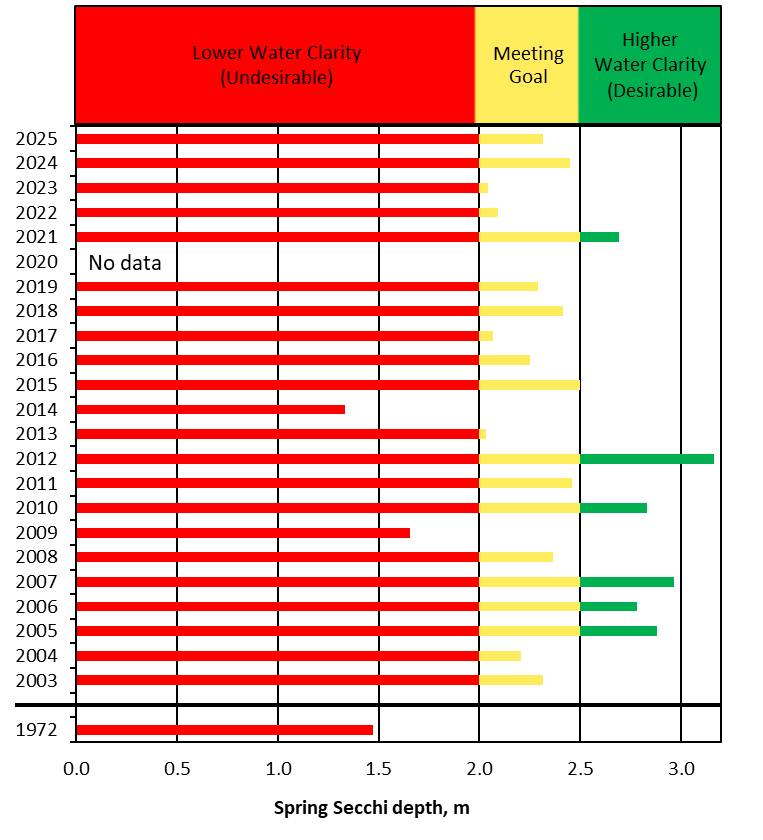
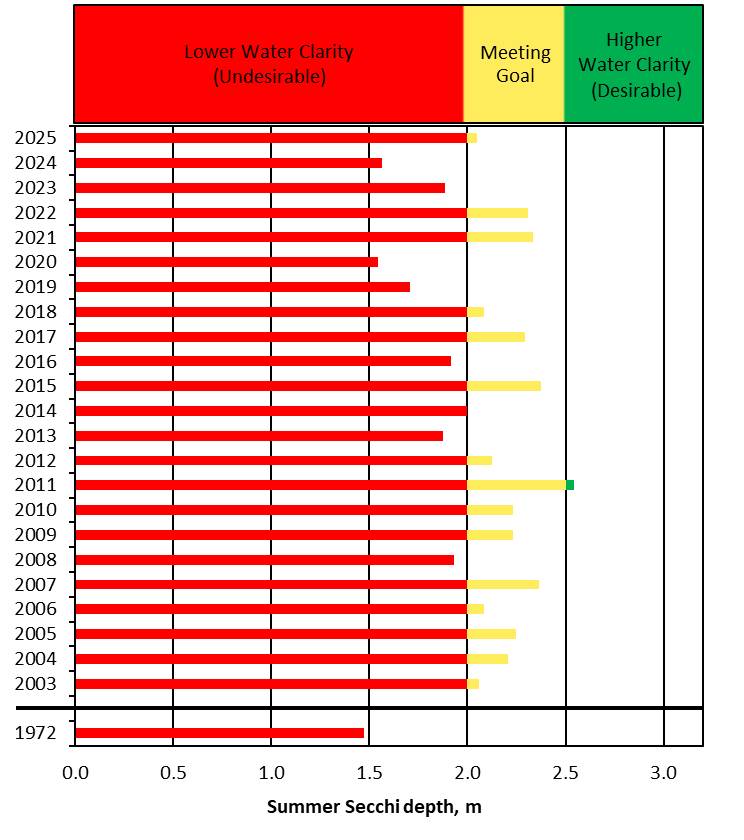
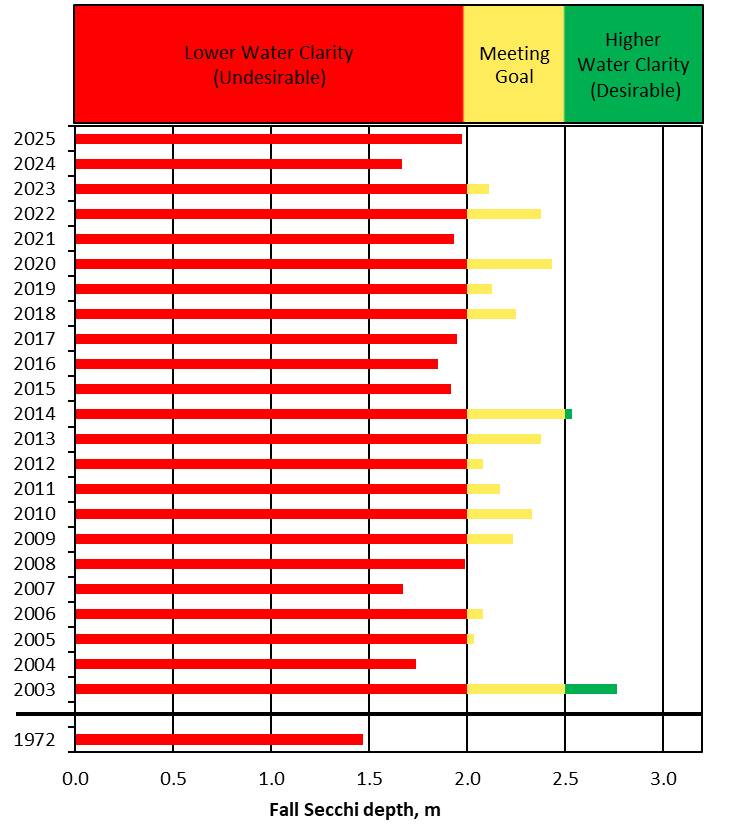
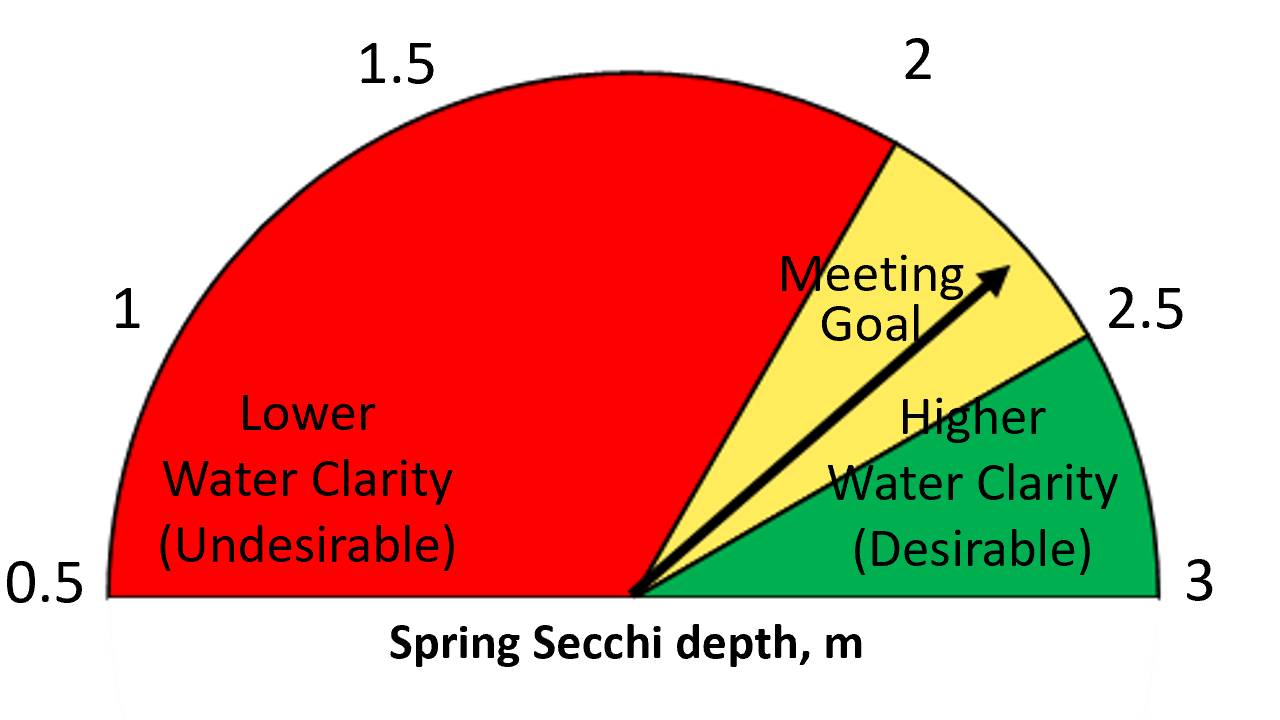
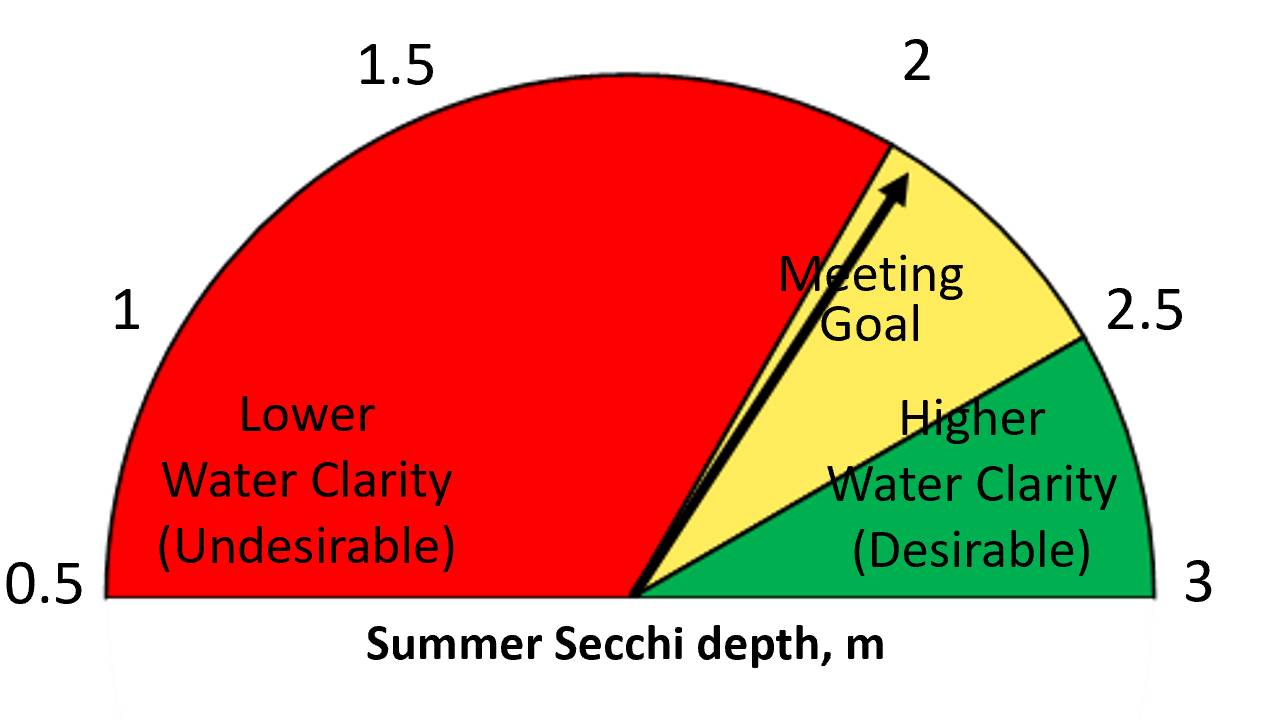
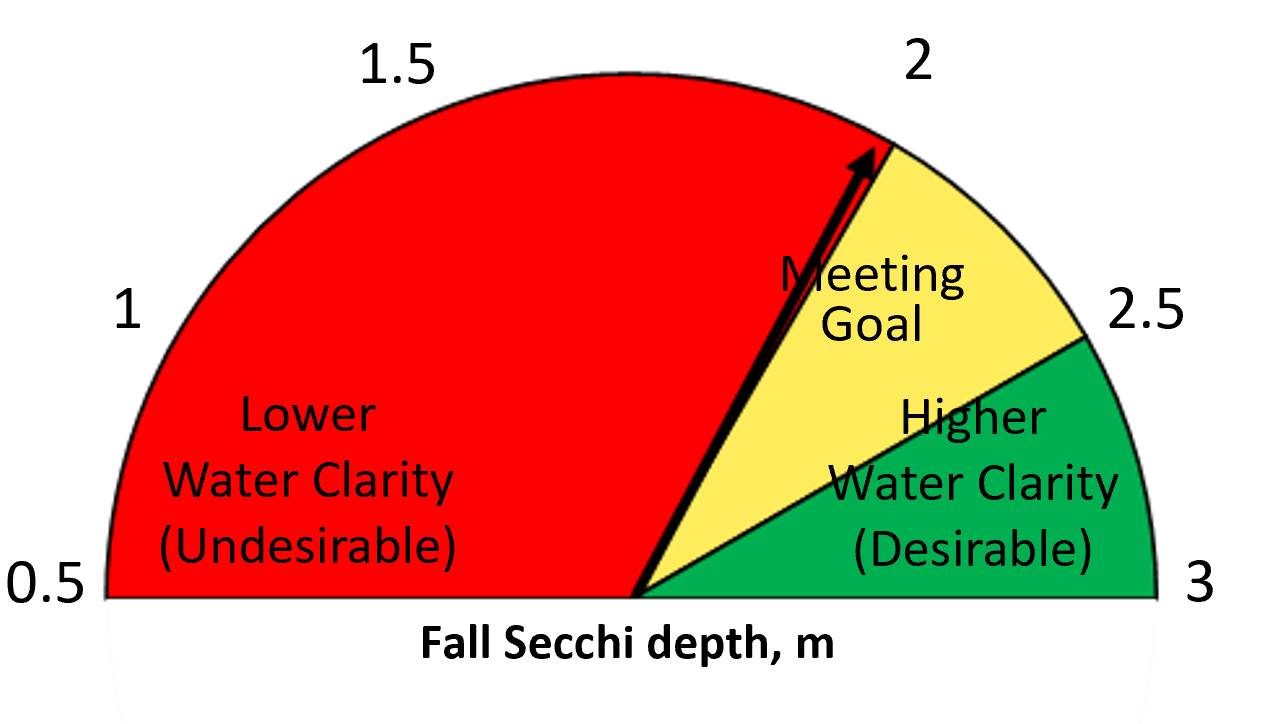
Secchi disk depth is an estimate of water clarity, measured using a standard black and white disk. Low water clarity can be the result of algal biomass, suspended particulate matter, or natural staining of the water. The Secchi depth dashboard was created by calculating seasonal average Secchi disk depths measured at the 6 long-term monitoring stations. Historical data collected by the US EPA (Freedman et al. 1979) are included as a reference point for historical conditions. Unlike TP and chlorophyll a, the larger (i.e., deeper) the Secchi depth number, the better the water quality.
In 2025, the status for Secchi depth qualified as the Meeting Goal category for spring and summer and only slightly within the Undesirable threshold in fall. Overall in 2025, the annual mean Secchi disk depth was 2.11 m, representing an improved depth of water clarity from 2024 (1.89 m) and achieving the Meeting Goal restoration target.
Data sources: Freedman et al. (1979); Muskegon Lake Long-term Monitoring Program, Steinman et al. (2008) and AWRI (unpublished data)
Dissolved Oxygen
2022 Mean % Days < 2 mg/L: 26%
Target Mean % Days < 2 mg/L: 25%
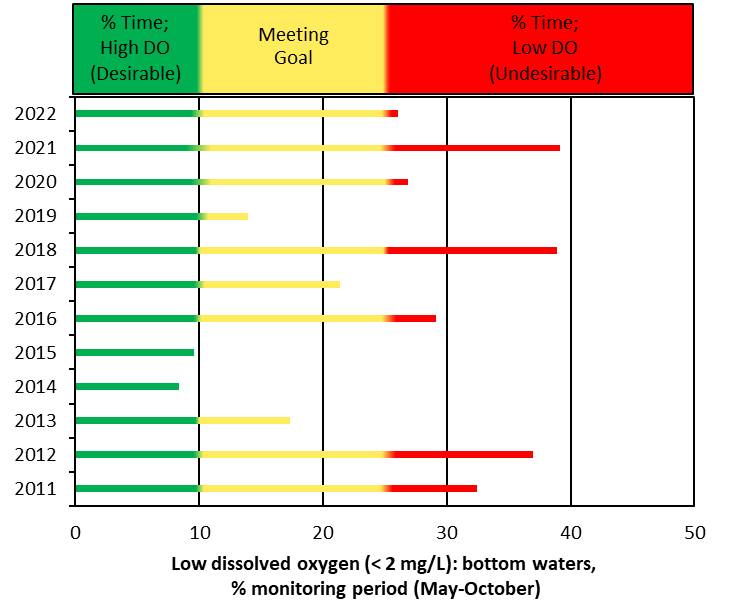
The Muskegon Lake Observatory buoy and its 11 m depth DO sensor were not launched in the 2023-2024 monitoring years; we anticipate it will be deployed again in 2025. Based on the latest data from when the buoy was deployed (2022), the dissolved oxygen indicator improved from 2021 although was within the Undesirable category, with 26% of the monitoring season having DO concentrations less than 2 mg/L. This improvement was similar to conditions seen in 2020.
Historical Status (2011-2022)
Data source: Muskegon Lake Observatory, B. Biddanda (unpublished data)
Well-oxygenated water is critical to the healthy functioning of aquatic ecosystems, including sustaining populations of fish and bottom-dwelling organisms, such as insects, worms, mollusks, and snails. In overly-productive (i.e., eutrophic) lakes, dissolved oxygen (DO) can become depleted in the bottom waters, particularly during summer months. The DO dashboard was created by calculating the percentage of time during the annual monitoring period (May-October) that the daily average DO was less than 2 mg/L in the bottom waters at the Muskegon Lake Observatory buoy.
Acknowledgements
We are very grateful to the many people associated with collecting the data on Muskegon Lake that help inform this year's dashboard, including Bopi Biddanda, Mike Hassett, Brian Scull, Katie Tyrrell, Eric Hecox, Paul Haley, Tim Halloran, Ben Morrison, Lexy Porter, Mya Harmer, Ashley Suttner, Kaylynne Dennis, Dee Phillips, Bridget Rozema, Emma Van Eerden, Zulekha Alemayehu, and Bennett McAfee.
We also gratefully acknowledge the Community Foundation for Muskegon County and the National Oceanic and Atmospheric Administration (NOAA) for helping to fund the monitoring efforts in Muskegon Lake.
References
Freedman, P., R. Canale, and M. Auer. 1979. The impact of wastewater diversion spray irrigation on water quality in Muskegon County lakes. U.S. Environmental Protection Agency, Washington, D.C. EPA 905/979006-A.
Liu, B., McClean, C.E., Long, D.T., Steinman, A.D., and R.J. Stevenson. 2018. Lake eutrophication and recovery over a 200-year period of post-native American settlement was determined by a complex set of local and regional factors. Science of the Total Environment 628-629: 1352-1361.
Steinman, A.D., M. Ogdahl, R. Rediske, C.R. Ruetz III, B.A. Biddanda, and L. Nemeth. 2008. Current status and trends in Muskegon Lake, Michigan. Journal of Great Lakes Research 34: 169-188.