Discovering Climate Vulnerability
Discovering Climate Vulnerability
Subject Area(s): Climate Vulnerability and Environmental Justice
Grade Level(s): High School
Author: Samuel Bonser, Grand Valley State University
Pacing Guide: 6 class periods
Day one: Engage lesson & Start of Explore lesson
Day two: Explore lesson
Day three: Explain lesson
Day four- Elaborate lesson: research & drafting
Day five- Elaborate lesson: editing & revising
Day six- Elaborate lesson: completion of story
Objectives:
- Students will identify relationships between environmental and demographic data spatial patterns
- Students will analyze the impacts of climate change and human vulnerability to its impacts in Michigan
- Students will familiarize themselves with online spatial datasets from several national and international agencies and engage in data analysis and interpretation.
- Students will develop a fictional story predicting future outcomes to recap their understanding of climate change scenarios and as well as biophysical and socioeconomic factors that affect human vulnerability.
Standards
Michigan Science Standards
Performance Expectations
- HS-ESS3-6. Use a computational representation to illustrate the relationships among Earth systems and how those relationships are being modified due to human activity.
Disciplinary Core Ideas
- ESS3.D: Global Climate Change Human activities, such as the release of greenhouse gases from burning fossil fuels, are major factors in the current rise in Earth’s mean surface temperature (global warming). Reducing the level of climate change and reducing human vulnerability to whatever climate changes do occur depend on the understanding of climate science, engineering capabilities, and other kinds of knowledge, such as understanding of human behavior and on applying that knowledge wisely in decisions and activities.
- LS2.A: Interdependent Relationships in Ecosystems Organisms, and populations of organisms, are dependent on their environmental interactions both with other living things and with nonliving factors. In any ecosystem, organisms and populations with similar requirements for food, water, oxygen, or other resources may compete with each other for limited resources, access to which consequently constrains their growth and reproduction. The growth of organisms and population increases are limited by access to resources.
Cross-Cutting Concepts
- Stability and Change
- Cause and effect
- Patterns
Science and Engineering Practice
- Analyzing and interpreting data
- Constructing explanations and design solution
Michigan Technology Standards
- 1B-DA-07 Use data to highlight or propose cause-and-effect relationships, predict outcomes, or communicate an idea.
Michigan Social Studies Standards:
- P1.1 Use appropriate strategies to read and analyze social science tables, graphs, graphics, maps, and texts.
- P1.5 Construct and present an argument supported with evidence.
- P2.1 Apply methods of inquiry, including asking and answering compelling and supporting questions, to investigate social science problems.
But first...
Key Concepts
Define Vulnerability
Impacts of Climate Change
Procedure
Engage:
- The teacher introduces the concepts of climate change and its impacts on society by showing students the IPCC Interactive Atlas and Global Climate Change Vital Signs of the Planet.
- First, the teacher will pull up the IPCC Interactive Atlas and show the students a side-by-side comparison if the Earth warmed by 1.5 degrees Celsius versus if the Earth warmed by 3 degrees Celsius.
- To get a side-by-side comparison view click on the button called “duplicate map” on the right-hand side.
- Ask students to make observations about what they notice and call on students to explain what they see. During this ask students the following questions to gain a better understanding of the student’s background knowledge and misconceptions:
- What do you notice about these two maps? (Trends, specific locations that stand out, specific data points, similarities, differences, etc.)
- How do you think the temperature on the left versus the temperature of Earth on the right would affect us as humans?
- How would it affect our school? Family? Home? Food?
- Who would be most affected?
- Who in Michigan would be most affected and why?
- Next change the settings to make the left map show total precipitation for a 1.5 degree C change and the right map show total precipitation for a 3 degree C change and ask students to answer the following questions creating a class discussion:
- What do you notice about these two maps? (Trends, specific locations that stand out, specific data points, similarities, differences, etc.)
- How do you think the temperature on the left versus the temperature of Earth on the right would affect us as humans?
- How would it affect our school? Family? Home? Food?
- Who would be most affected?
- Who in Michigan would be most affected and why?
- Lastly, adjust both maps to show consecutive dry days for both 1.5 degrees C and 3 degrees C.
- What do you notice about these two maps? (Trends, specific locations that stand out, specific data points, similarities, differences, etc.)
- How do you think the temperature on the left versus the temperature of Earth on the right would affect us as humans?
- How would it affect our school? Family? Home? Food?
- Who would be most affected?
- First, the teacher will pull up the IPCC Interactive Atlas and show the students a side-by-side comparison if the Earth warmed by 1.5 degrees Celsius versus if the Earth warmed by 3 degrees Celsius.
The Climate System is Unequivocal
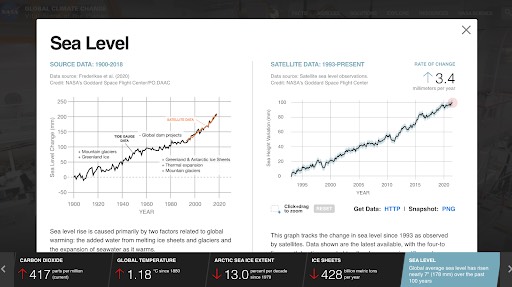
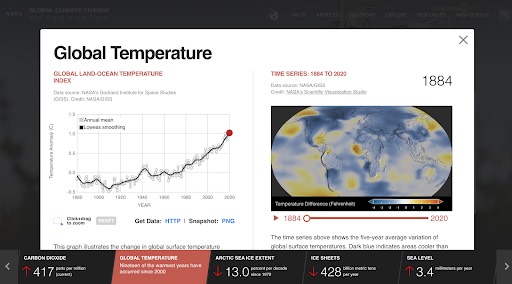
2. Next, the teacher will go to Global Climate Change Vital Signs of the Planet.
- The teacher will show the global temperature by clicking on the tab that says “global temperature” at the bottom. This will then bring up both a graph and a quick timelapse video to show how it has been changing.
- The teacher will also show the sea level by clicking on the tab at the bottom that says “sea level” which will bring up two graphs.
- The teacher can walk through both of these with the students and have the students make observations and ask students the following questions to create interest and understand their background knowledge and misconceptions.
- What do you notice about this data? (Trends, specific topics, etc.)
- How do you think these vital signs are affecting things on earth? Good or bad?
- How does this affect us in the classroom? At home? Food? Water?
- Who will this affect the most? Why?
- What area in Michigan do you think will be most affected?
- Who do you think in Michigan is affected the most?
3. The teacher will then explain that we will be exploring more data to give us answers to some of these questions and analyze locations and how these vital signs might affect different locations and the people there.
Why Study Vulnerability?
Explore
- Students will be uncovering ideas about vulnerability by looking at the state of Michigan and specific cities within the state through the completion of the Exploring Vulnerability Packet.
- *Optional* Prior to completing the packet the students are encouraged to go to the following websites to gather an idea about the two cities that the packet focuses on:
- Students can complete the Exploring Vulnerability Packet on their computer or this can be printed out by the teacher.
- Students can also go to the following website to help view the data and maps used throughout the packet:
- The teacher will review the answer with the students after their completion of the packet and use the Exploring Vulnerability Packet- KEY to help with answers.
Explain
- The teacher will explain that the data the students looked at focused on vulnerability and climate change and with that comes three main terms that help explain vulnerability in situations; exposure, sensitivity, and adaptive capacity.
- The teacher will write the following terms and definitions on the board and explain them using examples for each term.
- Exposure: How at risk someone and someone’s things can be affected by changing climate
- Elevation, slope, terrain, soils, distance from the coast, distance from the flood plain, wind speed
- Sensitivity: How much someone can be harmed by changing climate
- Population age, gender, health, wellness, fitness, mobility, occupation, lifestyle
- Adaptive capacity: The ability for someone to adjust, cope, and limit the damage due to changing climate
- Access to information, education, transportation, insurance, finances, evacuation plan
- Definitions summarized from: “Vulnerability, risk and adaptation: A conceptual framework”
- Access to information, education, transportation, insurance, finances, evacuation plan
- Exposure: How at risk someone and someone’s things can be affected by changing climate
- The students will be asked to share their answers and findings to the Exploring Vulnerability Packet. When the students explain their answers they will be asked to relate their findings to the terms; vulnerability, exposure, sensitivity, and adaptive capacity especially when it comes to comparing cities and the effects the climate can have on the population living there.
Exposure, Sensitivity, Adaptive Capacity
Elaborate
- Students will develop their own fictional story, writing a prediction of the future based on the current climate change trends in the state of Michigan or another part of the world, and what they think will happen in forty years and the impact it will have on their main character of the story. Through the story, the student will describe the character’s vulnerability and make clear the character’s exposure, sensitivity, and adaptive capacity.
- The students should be encouraged to do research on the future of the Earth and can use the following websites and others to help with ideas and data:
- *Optional* Teachers have the option to have students read a fictional book predicting events based on climate to help the students with ideas and create further interest.
- Book List
- Reading Guides from Climate Generation to help guide teachers who decide to have students use books.
- Students will be handed out the rubric and will be given two and a half class periods to complete the story. Midway through this time, the teacher will have students read over another student’s draft helping give feedback to their draft. The student will then have the remaining class period to complete it and if not completed can be sent home as homework.
- My Prediction Story Directions and Rubric
- The teacher will collect the student’s work and use this as an assessment to grade the student’s understanding of vulnerability, climate change, and ability to make predictions based on interpreting data.
Examples of different experiences with climate change
Evauate
- Engage:
- Take mental or physical notes on students' understanding and previous background knowledge about climate change and vulnerability. This will allow the teacher to have an understanding of how the pace of the lesson should go based on the student’s background knowledge.
- Explore:
- Discuss and review the Exploring Vulnerability Packet taking notes on students’ understanding of the data.
- Explain:
- Use the Exploring Vulnerability Packet- KEY to help take notes on what the students are understanding from the packet and if they are making connections to vulnerability, exposure, sensitivity, and adaptive capacity.
- Elaborate:
Evaluate the student’s paper using the My Prediction Story Directions and Rubric
Materials
Engage
- IPCC Interactive Atlas
- Global Climate Change Vital Signs of the Planet
- Projector screen
- Whiteboard and markers
Explore
- Exploring Vulnerability Packet
- Exploring Vulnerability Packet- KEY
- Google Maps- Detroit
- Google Maps- Manistique
- https://censusreporter.org/profiles/16000US2622000-detroit-mi/
- https://censusreporter.org/profiles/16000US2650760-manistique-mi/
Explain
- Whiteboard and markers
- Projector (if the teacher wants to display the packet while students share answers to questions)
Elaborate
- My Prediction Story Directions and Rubric
- Pencil and paper or laptops (for students to write their story on)
- Student laptops (if available)
- Websites to help research:
Evaluate
NASA Tools/Resources used in lesson or to supplement lesson:
- https://climate.nasa.gov/
- https://www.epa.gov/ejscreen
- https://michiganview.org/
- https://interactive-atlas.ipcc.ch/
- https://nca2018.globalchange.gov/
- https://glisa.umich.edu/great-lakes-regional-climate-change-maps/
- Vulnerability, risk and adaptation: A conceptual framework
- Google Maps- Detroit
- Google Maps- Manistique
- https://censusreporter.org/profiles/16000US2622000-detroit-mi/
- https://censusreporter.org/profiles/16000US2650760-manistique-mi/
References
- https://climate.nasa.gov/
- https://www.epa.gov/ejscreen
- https://michiganview.org/
- https://interactive-atlas.ipcc.ch/
- https://nca2018.globalchange.gov/
- https://glisa.umich.edu/great-lakes-regional-climate-change-maps/
- Google Maps- Detroit
- Google Maps- Manistique
- https://censusreporter.org/profiles/16000US2622000-detroit-mi/
- https://censusreporter.org/profiles/16000US2650760-manistique-mi/
- Reading Guides
- Vulnerability, risk, and adaptation: A conceptual framework”