Stream Restoration Planning Based on Watershed-Scale Stressor-Response Functions
James N. McNair, Annis Water Resources Institute, Grand Valley State University
Overview
The overarching purpose of this group of related projects is to develop an improved computer-based tool for quantifying the relationship between the integrity of biological assemblages in a stream and the level of land cover-related stressors in the contributing drainage basin. Such a tool will allow watershed managers to predict the degree of improvement in stream communities that would result from alternative restoration projects. It will, therefore, assist managers in making rational decisions regarding the sizes and locations of restoration projects that are most likely to achieve specific ecological goals. Sediment and nutrients are viewed as stressors that act on stream biological assemblages, while metrics of stream ecological integrity (e.g., taxa diversity, taxa richness, Hilsenhoff Biotic Index, Index of Biotic Integrity) are viewed as measures of the ecological response to stressor levels. If there is a clear relationship between the level of a stressor and a particular biological metric, then this relationship called a stressor-response relationship can be used to predict the ecological integrity of stream reaches, based on measured or computed stressor levels in the reaches.
Stressor-response functions for quantitatively predicting stream ecological responses to sediment and nutrients are useful to watershed managers as a planning tool. For example, using a Geographic Information System (GIS), managers can simulate potential restoration projects for an impaired stream reach by modifying spatial data layers (e.g., land cover, erosion management practices, point-source loadings) that would be altered by the projects. These data layers can then be used by the model we are developing to predict the resulting sediment and nutrient loads for the contributing drainage basin. With accurate and precise stressor-response functions, these loads can in turn be used to predict the resulting degree of improvement in ecological integrity of the impaired stream reach, based on the same biological metrics originally used to classify the reach as impaired. In this way, the likely outcomes of alternative restoration projects can be assessed objectively and quantitatively, costs can be compared, and defensible decisions can be made.
Study Basins
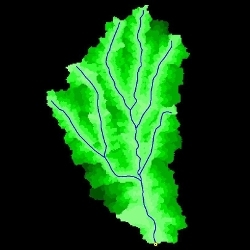
These projects currently are focused on drainage basins within the Schuylkill River watershed. To minimize differences due to climate and physiography, all basins were chosen to lie within the Gettysburg-Newark Lowland section of the Piedmont physiographic province. Study basins were chosen based on stream locations for which suitable benthic macroinvertebrate data were available and were delineated within a GIS using a 30-m DEM. A total of 65 drainage basins were studied, ranging in size from 257 to 4,402 hectares.
Geospatial and Biological Data
These projects employed several different approaches to quantifying stressor levels and ecological responses, but the data inputs were broadly similar. The geospatial data included several types of readily available raster (30-m resolution) and vector data, such as land cover, elevation, soil types, basic management practices (mainly agricultural), rainfall-runoff erosivity, and stream networks. The biological data consisted of quantitative data on stream benthic macroinvertebrates (family-level taxonomy), which is available from the Pennsylvania Department of Environmental Protection for thousands of stream locations throughout the state. The raw biological data were used to calculate a variety of indexes that are commonly used to characterized the integrity of stream benthic macroinvertebrate assemblages, including total abundance, taxa richness, taxa evenness, taxa diversity, Hilsenhoff Biotic Index, proportion and taxa richness of Ephemeroptera (E), proportion and taxa richness of Plecoptera (P), proportion and taxa richness of Trichoptera (T), proportion and taxa richness of combined EPT, proportion Chironomidae, proportion collector-gatherers, proportion collector-filterers, proportion scrapers, proportion shredders, and proportion predators.
Modeling Approach
The watershed management tool we are developing is a GIS-based computer model that:
- Accepts spatial data on elevation, land cover, land use, and stressor loadings (e.g., sediment, nitrogen, phosphorus) of each watershed grid cell as input
- Routes the stressor load from each grid cell along an estimated hydrologic flow path through the terrestrial component of the watershed and then through the stream network to the watershed outlet
- Attenuates the stressor load along its transport route to the watershed outlet, taking into account the land cover of each grid cell along the route
- Determines the cumulative in-stream load (or concentration) of each stressor at the assessment point in the stream network (the outlet of the contributing drainage basin)
- Predicts the effect of the cumulative in-stream stressor loads (or concentrations) at the assessment point on several biological endpoints for which data are routinely collected in state stream assessments as indicators of ecological integrity.
A key design criterion of the model is that its implementation must require only readily available types of data, so that no expensive, labor-intensive, and time-consuming data collection effort is necessary. Another basic design criterion is that, once a user-friendly graphical user interface has been developed, the model will be suitable for use by individuals with relatively little technical expertise. A more-detailed description of the modeling approach can be found here (PDF).
Examples
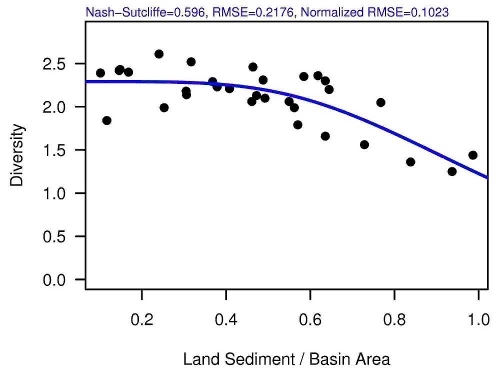
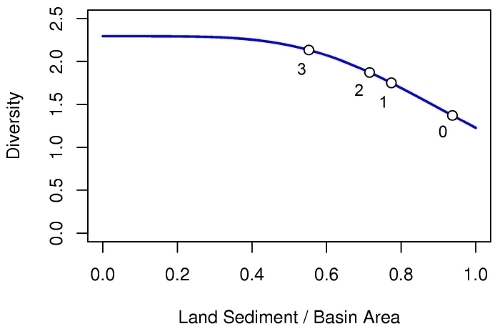
EXAMPLE 1. The figure below shows a fitted stressor-response function. The ecological response in this example is Shannon diversity of the stream benthic macroinvertebrate assemblage, while the stressor is mean annual sediment load (excluding sediment due to bank erosion) divided by catchment area. The Nash-Sutcliffe coefficient indicates that the (logistic) stressor-response function explains roughly 60% of total variation in diversity.
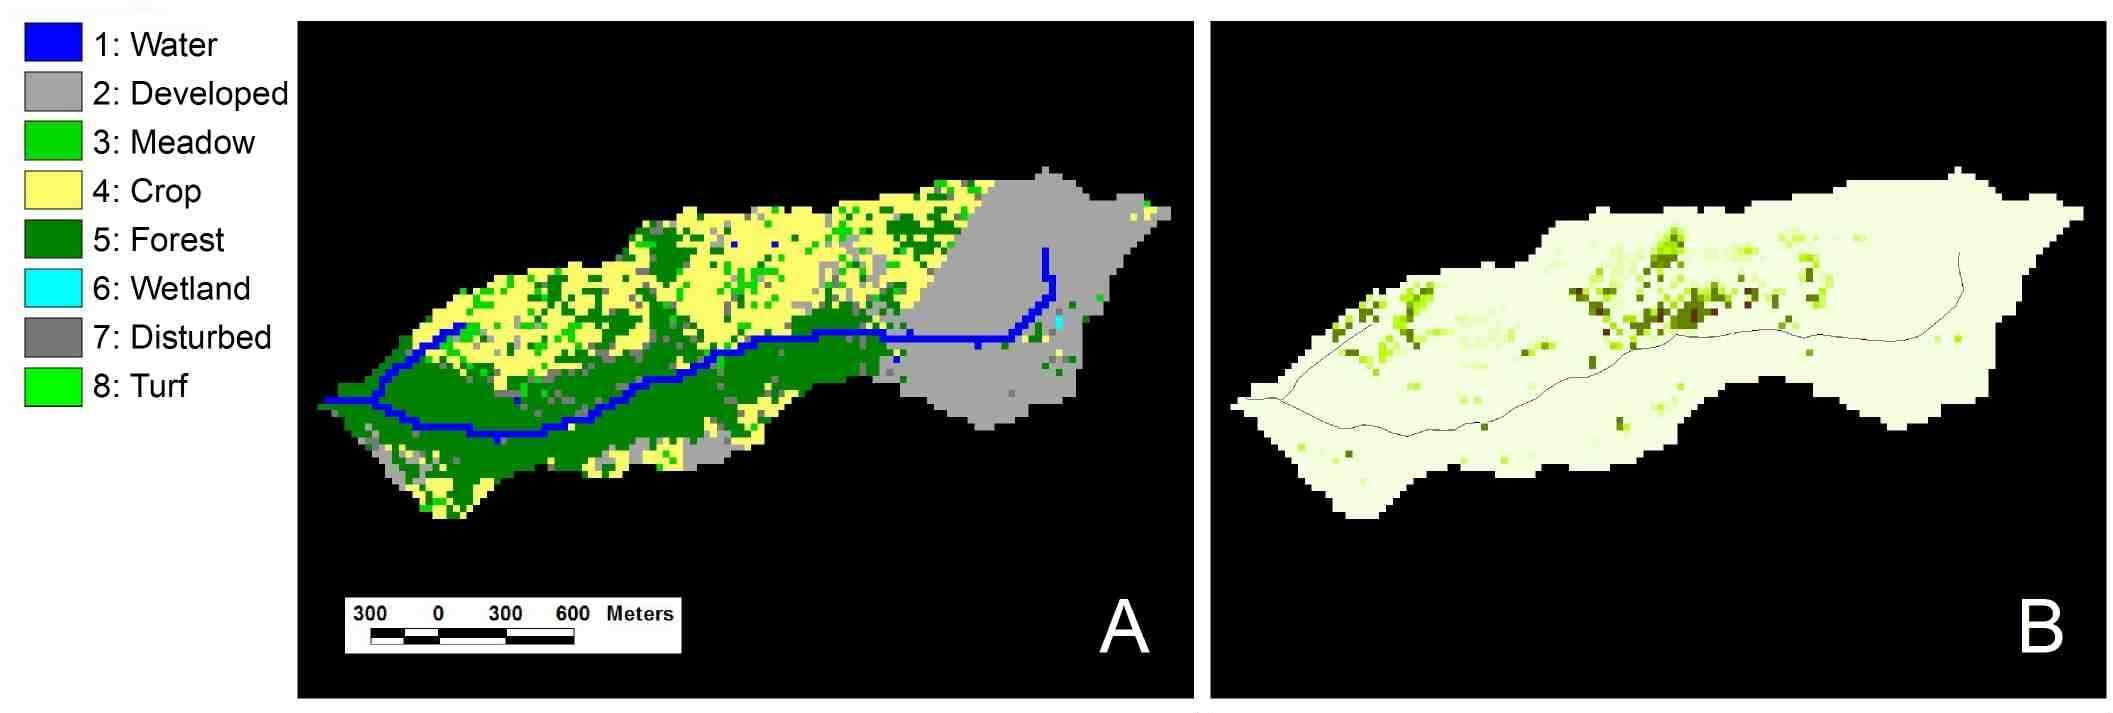
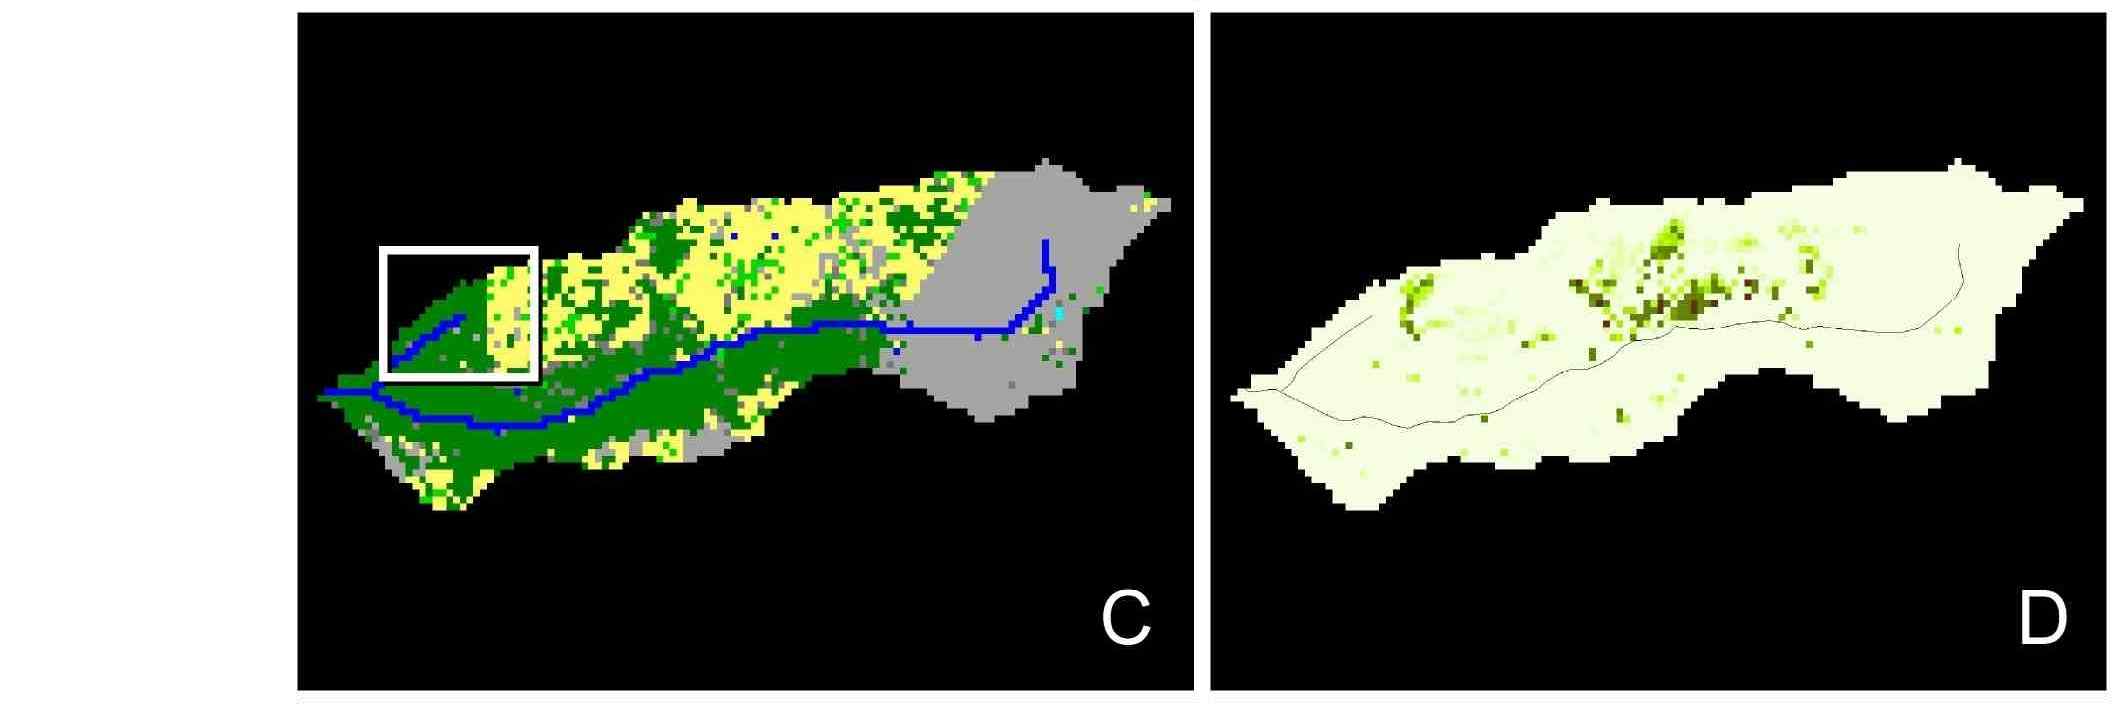
EXAMPLE 2. The figure below shows several hypothetical restoration projects and their effects on mean annual soil erosion. Left panels show land cover before (A) and after (C, E, G) three alternative hypothetical restoration projects. Approximate locations of restored areas are indicated by white rectangles in panels C, E, and G. Erosion rates in the right panel are indicated by color darkness; the darker the color, the higher the erosion rate. Note that erosion rates are reduced in restored areas, where Crop and Meadow land cover is replaced by Forest. Predicted effects of the restoration projects on mean annual Land Sediment / Basin Area and on benthic macroinvertebrate Diversity are shown in Example 3 below.
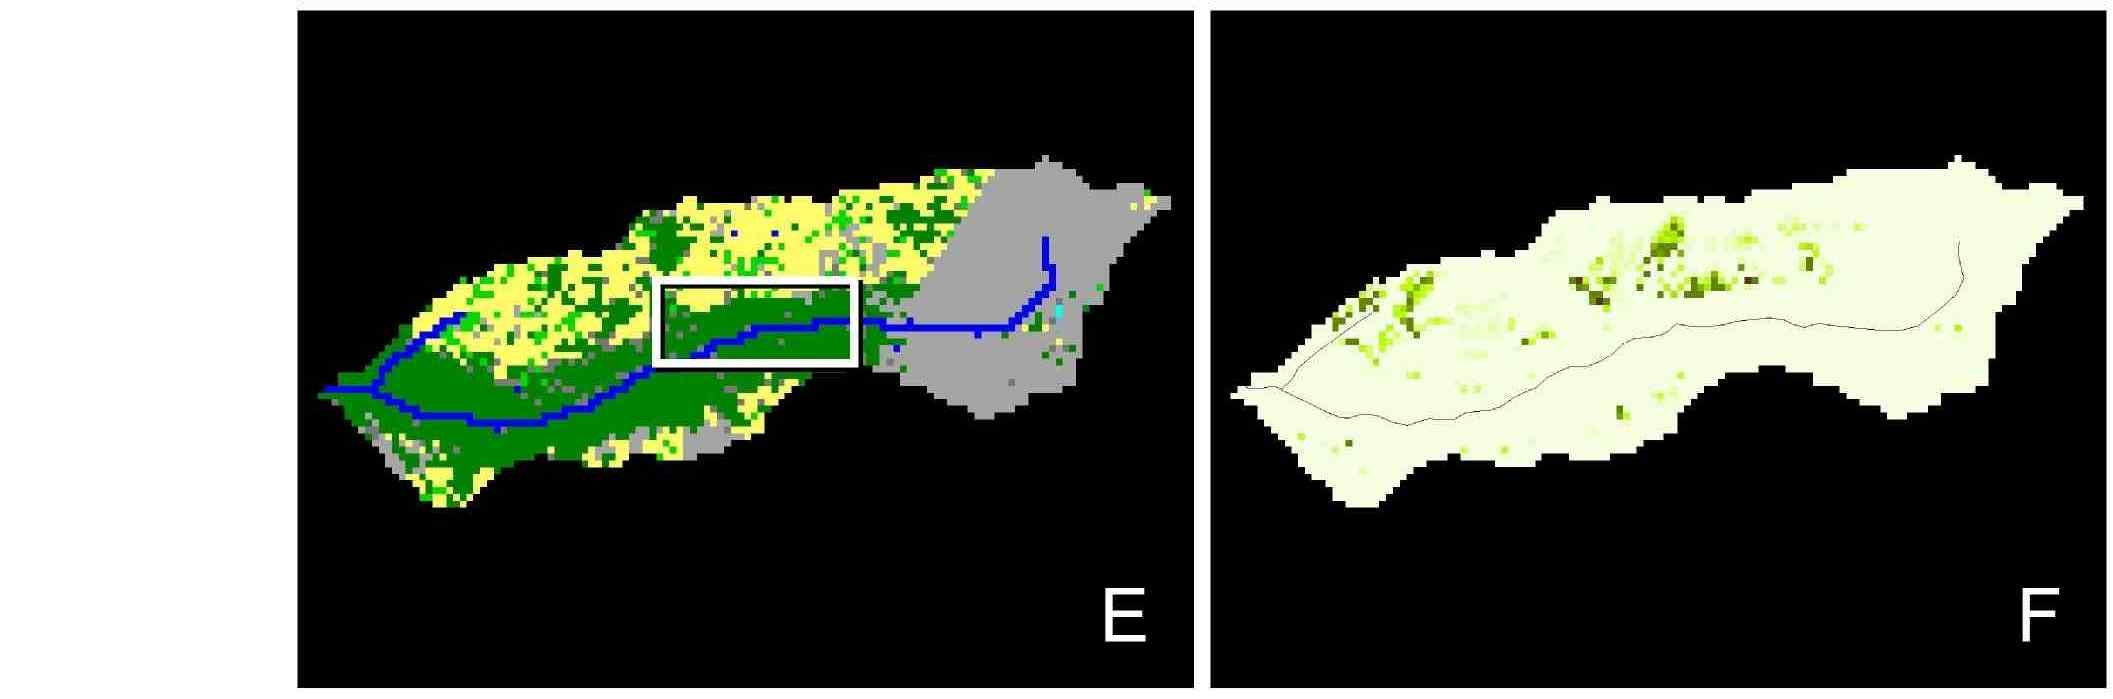
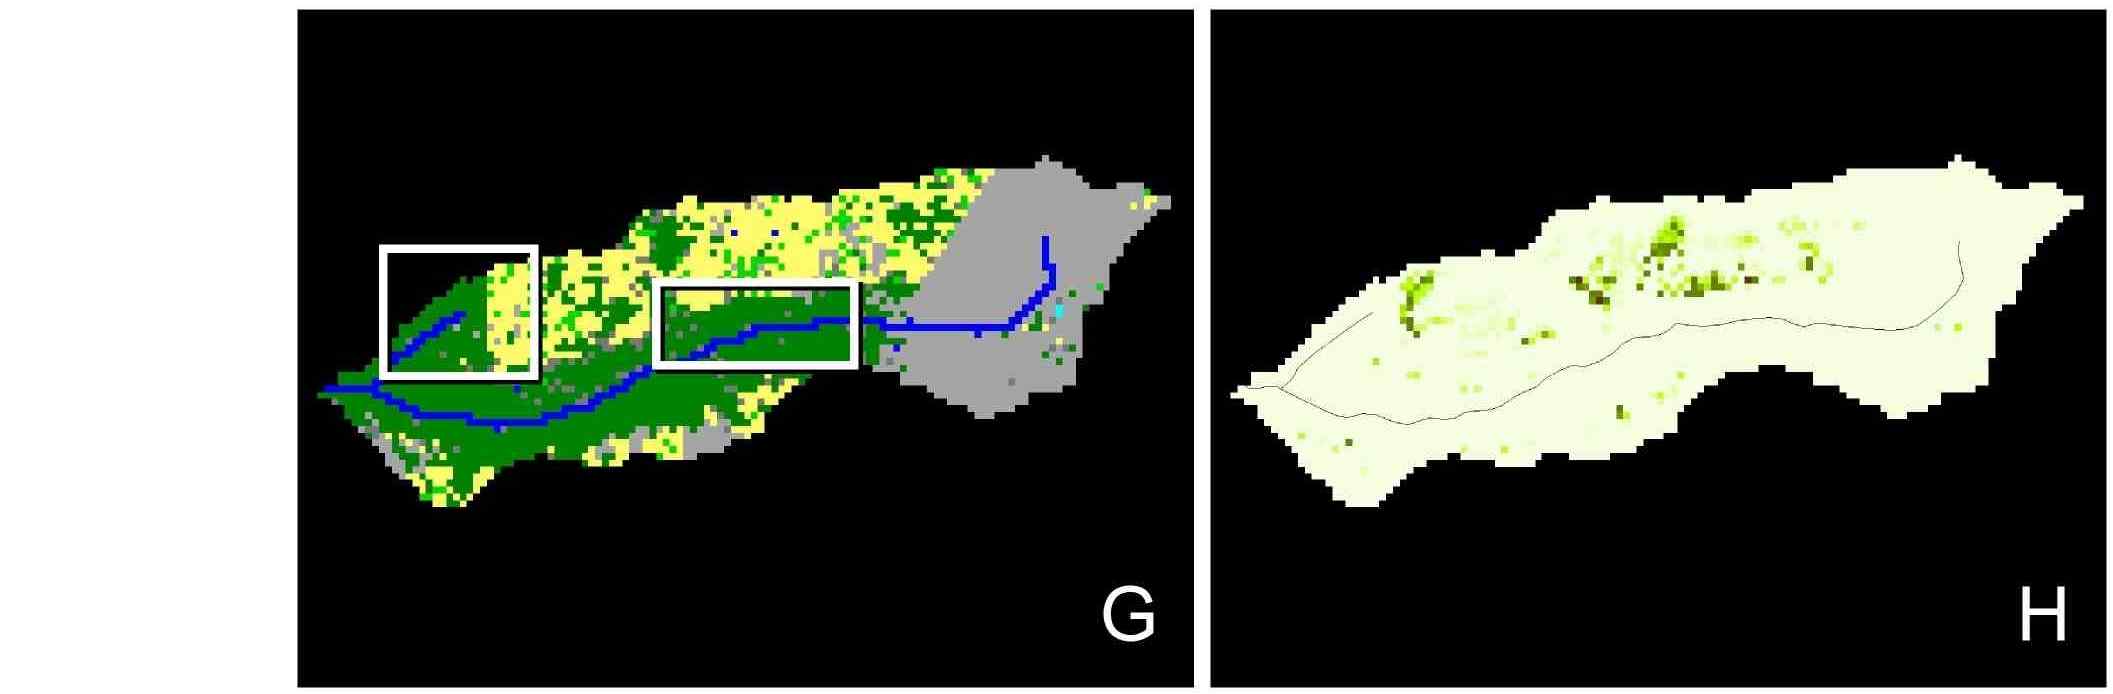
EXAMPLE 3. The figure below show predicted effects of the hypothetical restoration projects shown in Example 2 on benthic macroinvertebrate diversity. The blue curve is the fitted stressor-response function for diversity shown in Example 1. Labeled circles on this curve indicate the predicted values of diversity for the cases shown in the following figure panels of Example 2: 0 – panels A and B; 1 – panels C and D; 2 – panels E and F; 3 – panels G and H.
Selected Publications
McNair, J.N. 2009. Two new methods for predicting effects of land cover-related stressors on stream biotic integrity at the catchment scale. Proceedings of the Academy of Natural Sciences of Philadelphia 158: 61–88.
Johnson, T.E., McNair, J.N., Srivastava, P., and Hart, D.D. 2007. Stream ecosystem responses to spatially variable land cover: a model for developing riparian restoration strategies. Freshwater Biology 52: 680–695.